. 2011;6(10):e25921.
doi: 10.1371/journal.pone.0025921. Epub 2011 Oct 5.

Hydrogen sulfide protects against chemical hypoxia-induced injury by inhibiting ROS-activated ERK1/2 and p38MAPK signaling pathways in PC12 cells

Affiliations

Hydrogen sulfide protects against chemical hypoxia-induced injury by inhibiting ROS-activated ERK1/2 and p38MAPK signaling pathways in PC12 cells

Aiping Lan et al. PLoS One. 2011.

Abstract

Hydrogen sulfide (H(2)S) has been proposed as a novel neuromodulator and neuroprotective agent. Cobalt chloride (CoCl(2)) is a well-known hypoxia mimetic agent. We have demonstrated that H(2)S protects against CoCl(2)-induced injuries in PC12 cells. However, whether the members of mitogen-activated protein kinases (MAPK), in particular, extracellular signal-regulated kinase1/2(ERK1/2) and p38MAPK are involved in the neuroprotection of H(2)S against chemical hypoxia-induced injuries of PC12 cells is not understood. We observed that CoCl(2) induced expression of transcriptional factor hypoxia-inducible factor-1 alpha (HIF-1α), decreased cystathionine-β synthase (CBS, a synthase of H(2)S) expression, and increased generation of reactive oxygen species (ROS), leading to injuries of the cells, evidenced by decrease in cell viability, dissipation of mitochondrial membrane potential (MMP) , caspase-3 activation and apoptosis, which were attenuated by pretreatment with NaHS (a donor of H(2)S) or N-acetyl-L cystein (NAC), a ROS scavenger. CoCl(2) rapidly activated ERK1/2, p38MAPK and C-Jun N-terminal kinase (JNK). Inhibition of ERK1/2 or p38MAPK or JNK with kinase inhibitors (U0126 or SB203580 or SP600125, respectively) or genetic silencing of ERK1/2 or p38MAPK by RNAi (Si-ERK1/2 or Si-p38MAPK) significantly prevented CoCl(2)-induced injuries. Pretreatment with NaHS or NAC inhibited not only CoCl(2)-induced ROS production, but also phosphorylation of ERK1/2 and p38MAPK. Thus, we demonstrated that a concurrent activation of ERK1/2, p38MAPK and JNK participates in CoCl(2)-induced injuries and that H(2)S protects PC12 cells against chemical hypoxia-induced injuries by inhibition of ROS-activated ERK1/2 and p38MAPK pathways. Our results suggest that inhibitors of ERK1/2, p38MAPK and JNK or antioxidants may be useful for preventing and treating hypoxia-induced neuronal injury.


Conflict of interest statement

Competing Interests: The authors have declared that no competing interests exist.

Figures

Figure 1
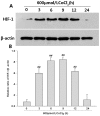
Figure 1. CoCl2-induced expression of HIF-1α in PC12 cells.
(A) time course for the effects of CoCl2 on expression of HIF-1α detected by western blot analysis; (B) Denstiometric analysis for the results in (A) with the Image J 1.41o software. Data were shown as the mean ± SE (n = 3). ## P<0.01 compared with control group (0h).
Figure 2
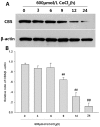
Figure 2. Effects of CoCl2 on the expression of CBS in PC12 cells.
PC12 cells were treated with 600 µmol/L CoCl2 for different times. (A) The expression levels of CBS in PC12 cells were examined by western blot and β-actin was used as internal control. (B) Denstiometric analysis for the data from (A) with the Image J 1.41o software. Values are the mean ± SE (n = 3). ## P<0.01 compared with control group (0h).
Figure 3
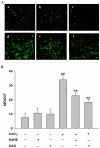
Figure 3. Effects of NaHS and NAC on CoCl2-induced overproduction of reactive oxygen species (ROS) in PC12 cells.
(A) Random micrographs of dichlorofluorescein (DCF)-derived fluorescence in PC12 cells. A-a: Control, untreated cells; A-b: NaHS group, cells were treated with 400 µmol/L NaHS for 30 min alone; A-c: NAC group, cells were treated with 500 µmol/L NAC for 60 min alone; A-d: CoCl2-treated group, CoCl2 cells treated with 600 µmol/L CoCl2 for 6 h; A-e: NaHS+CoCl2 group, cells were preconditioned with 400 µmol/L NaHS for 30min prior to treatment with 600 µmol/L CoCl2 for 6 h; A-f: NAC+CoCl2 group, cells were preconditioned with 500 µmol/L NAC for 60 min prior to treatment with 600 µmol/L CoCl2 for 6 h; (B) Quantitative analysis of the mean fluorescence intensity in the indicated groups. Data are the mean ± SE (n = 3). ## P<0.01 compared with control, **P<0.01 compared with CoCl2-treated group.
Figure 4
Figure 4. CoCl2-induced activation of ERK1/2, p38MAPK and JNK in PC12 cells.
(A), (C) and (E) time course for the effects of CoCl2 on phosphorylation of ERK1/2, p38MAPK and JNK, respectively. (B), (D) and (F) Denstiometric analysis for the results in (A), (C) and (E), respectively. Data are presented as the mean ± SE (n = 3). # P<0.05, ## P<0.01 compared to the control group (0min), respectively.
Figure 5
Figure 5. NAC attenuated CoCl2-induced ERK1/2 and p38MAPK phosphorylation in PC12 cells.
PC12 cells were pretreated with 500 µmol/L NAC for 60 min prior to exposure of cells to 600 µmol/L CoCl2 for 30 min (A) and (B) or 120 min (C) and (D). Cell lysates were subjected to western blot analysis using anti-p-ERK1/2 and anti-ERK1/2 antibody (A) and (B) or anti-p-p38 and anti-p38 antibody (C) and (D). (B) and (D) show denstiometric analysis for the data from (A) or (C), respectively. Data are presented as mean ± SE from independent experiments preformed in triplicate. ## P<0.01 compared to the control group, **P<0.01 compared to the CoCl2 group.
Figure 6
Figure 6. NaHS attenuated CoCl2-induced ERK1/2 and p38 MAPK phosphorylation in PC12 cells.
PC12 cells were preconditioned with 400 µmol/L NaHS for 30min before exposure of cells to 600 µmol/L CoCl2 for 30 min (A) and (B) or for 120min (C) and (D). Cell lysates were subjected to western blot analysis using anti-p-ERK1/2 and anti-ERK antibody (A and B) or anti-p-p38 and anti-p38 antibody (C) and (D). Panels (B) and (D) show denstiometric analysis for the data from (A) or (C), respectively. Data are presented as mean ± SE from independent experiments preformed in triplicate. ## P<0.01 compared to the control group, **P<0.01 compared to the CoCl2 group.
Figure 7
Figure 7. Effects of kinase inhibitors on CoCl2-induced phosphorylation of p38MAPK and ERK1/2 as well as the gene silencing effect on their expressions.
PC12 cells were preconditioned with 10 µmol/L MEK1/2 (upstream of ERK1/2) inhibitor U0126 for 120 min and 20 µmol/L p38MAPK inhibitor SB203580 for 60 min before exposure of cells to 600 µmol/L CoCl2 for 30 min (A, B) and 120 min (C, D), respectively. Panels (B) and (D) show denstiometric analysis for the data from (A) or (C), respectively. (E) and (G) PC12 cells were co-cultured with small interfering RNA (Si-ERK1/2 and Si-p38MAPK) or random non-coding RNA (Si-NC) at 50 nmol/L for 6 h. Expressions of ERK1/2 and p38MAPK were detected by Western blot assay. Panels (F) and (H) show denstiometric analysis for the data from (E) and (G), respectively. Data are presented as mean ± SE from independent experiments preformed in triplicate. ## P<0.01 compared to the control group, **P<0.01 compared to the CoCl2 group.
Figure 8
Figure 8. ERK1/2, p38MAPK and JNK pathways mediated CoCl2-induced injuries in PC12 cells.
(A) and (B) The cell viability was assessed by the CCK-8 reduction method described in ‘Materials and methods’. The cells were treated with the indicated treatments. (C) Morphological changes in apoptotic cells assessed by Hoechst 33258 staining. Arrow indicates cells with apoptotic nuclear condensation and fragmentation. Control: untreated cells; SB203580: cells were treated with 20 µmol/L SB203580 for 60 min alone; UO126: cells were treated with 10 µmol/L UO126 for 120min alone; CoCl2: cells were treated with 600 µmol/L CoCl2 for 48 h; SB203580+ CoCl2: cells were pretreated with p38 inhibitor SB203580 (20 µmol/L) for 60 min followed by exposure of cells to 600 µmol/L CoCl2 for 48 h; UO126+ CoCl2: cells were pretreated with ERK1/2 inhibitor UO126 (10 µmol/L) for 120 min followed by exposure of cells to 600 µmol/L CoCl2 for 48 h. (D) Results from FCM analysis. Data are the mean ± SE (n = 3). ## P<0.01 compared with control; **P<0.01 compared with CoCl2-treated group.
Figure 9
Figure 9. Kinase inhibitors suppressed CoCl2-induced expression of cleaved-caspase-3.
(A) time course for the effects of CoCl2 on expression of cleaved-casepase-3. (A-b) Denstiometric analysis for the results in (A-a). Data are presented as the mean ± SD from independent experiments performed in triplicate. # P<0.05,## P<0.01 compared to the control group. (B) and (C) PC12 cells were preconditioned with 10 µmol/L MEK1/2 (upstream of ERK1/2) inhibitor U0126 for 120 min (B) and 20 µmol/L p38MAPK inhibitor SB203580 for 60 min (C) before exposure of cells to 600 µmol/L CoCl2 for 9 h. Panels B-b and C-b show denstiometric analysis for the data from B-a or C-a, respectively. Data are presented as mean ± SE from independent experiments preformed in triplicate. ## P<0.01 compared to the control group, **P<0.01 compared to the CoCl2 group.
Figure 10
Figure 10. H2S and NAC protected PC12 cells against CoCl2-induced injuries.
(A) The cell viability was assessed by the cell counter kit (CCK-8) described in ‘Materials and methods’. PC12 cells were treated with the indicated treatments. (B) Morphological changes in apoptotic cells assessed by Hochest 33258 staining. Arrow indicated cells with apoptotic nuclear condensation and fragmentation. Control: untreated cells; NaHS: cells were treated with 400 µmol/L NaHS for 30 min alone; NAC: cells were treated with 500 µmol/L NAC for 60 min alone; CoCl2: cells were treated with 600 µmol/L CoCl2 for 48 h; NaHS+CoCl2: cells were preconditioned with 400 µmol/L NaHS for 30 min prior to treatment with 600 µmol/L CoCl2 for 48 h; NAC+CoCl2: cells were preconditioned with 500 µmol/L NAC for 60 min prior to treatment with 600 µmol/L CoCl2 for 48 h; (C) The apoptotic rate was analysed with a cell counter of Image J 1.41o software. Data are the mean ± SE (n = 3). ## P<0.01 compared to the control group, **P<0.01 compared to the CoCl2 group.
Figure 11
Figure 11. H2S and NAC suppressed CoCl2-induced expression of cleaved-caspase-3.
(A) PC12 cells were preconditioned with 400 µmol/L NaHS for 30 min before exposure of cells to 600 µmol/L CoCl2 for 9 h; (B) Denstiometric analysis for the results in (A). (C) PC12 cells were preconditioned with 500 µmol/L NAC for 60 min before exposure of cells to 600 µmol/L CoCl2 for 9 h. (D) Denstiometric analysis for the results in (C). Data are presented as the mean ± SE from independent experiments performed in triplicate. ## P<0.01 compared to the control group, ** P<0.01 compared to the CoCl2 group.
Figure 12
Figure 12. H2S and NAC protected PC12 cells against CoCl2-induced mitochondrial insult.
MMP was assessed by JC-1 staining. Dual emission images (527 and 590nm) represent the signals from monomeric (green) and J-aggregate (red) JC-1 fluorescence in PC12 cells. (A) Control, untreated cells; NaHS, cells were treated with 400 µmol/L NaHS for 30 min alone; NAC, cells were treated with 500 µmol/L NAC for 60 min alone; CoCl2, cells were treated with 600 µmol/L CoCl2 for 24 h; NaHS+ CoCl2, cells were preconditioned with 400 µmol/L NaHS for 30 min prior to treatment with 600 µmol/L CoCl2 for 24 h; NAC+CoCl2, cells were preconditioned with 500 µmol/L NAC for 60 min prior to treatment with 600 µmol/L CoCl2 for 24 h; (B) Quantitative analysis of the ratio of Red/Green fluorescence in each group, by using Image 1.41o software. Data are the mean ± SE (n = 3). ## P<0.01 compared to the control group; **P<0.01 compared to the CoCl2 group.

Similar articles

Cited by

References

    1. Abe K, Kimura H. The possible role of hydrogen sulfide as an endogenous neuromodulator. J Neurosci. 1996;16:1066–1071. - PMC - PubMed
    1. Kimura H. Hydrogen sulfide as a neuromodulator. Mol Neurobiol. 2002;26:13–9. - PubMed
    1. Ishigami M, Hiraki K, Umemura K, Oqasawara Y, Ishii K, et al. A source of Hydrogen sulfide and a mechanism of its release in the brain. Antioxid Redox Signal. 2009;11:205–14. - PubMed
    1. Furne J, Saeed A, Levitt MD. Whole tissue hydrogen sulfide concentrations are orders of magnitude lower than presently accepted values. Am J Physiol Regul Integr Comp Physiol. 2008;295:R1479–85. - PubMed
    1. Kimura H. Hydrogen sulfide induces cyclic AMP and modulates the NMDA receptor. Biochem Biophys Res Commun. 2000;267:129–133. - PubMed

Publication types

MeSH terms