. 2011;6(10):e25952.
doi: 10.1371/journal.pone.0025952. Epub 2011 Oct 5.

An angiotensin I-converting enzyme mutation (Y465D) causes a dramatic increase in blood ACE via accelerated ACE shedding

Affiliations

An angiotensin I-converting enzyme mutation (Y465D) causes a dramatic increase in blood ACE via accelerated ACE shedding

Sergei M Danilov et al. PLoS One. 2011.

Abstract

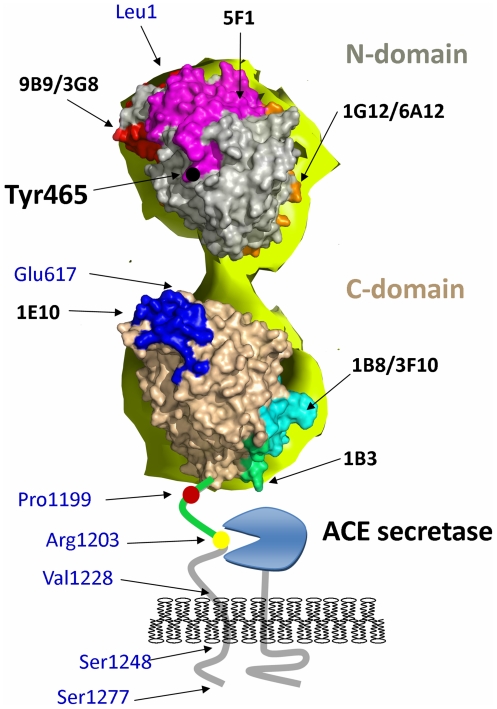
Background: Angiotensin I-converting enzyme (ACE) metabolizes a range of peptidic substrates and plays a key role in blood pressure regulation and vascular remodeling. Thus, elevated ACE levels may be associated with an increased risk for different cardiovascular or respiratory diseases. Previously, a striking familial elevation in blood ACE was explained by mutations in the ACE juxtamembrane region that enhanced the cleavage-secretion process. Recently, we found a family whose affected members had a 6-fold increase in blood ACE and a Tyr465Asp (Y465D) substitution, distal to the stalk region, in the N domain of ACE.

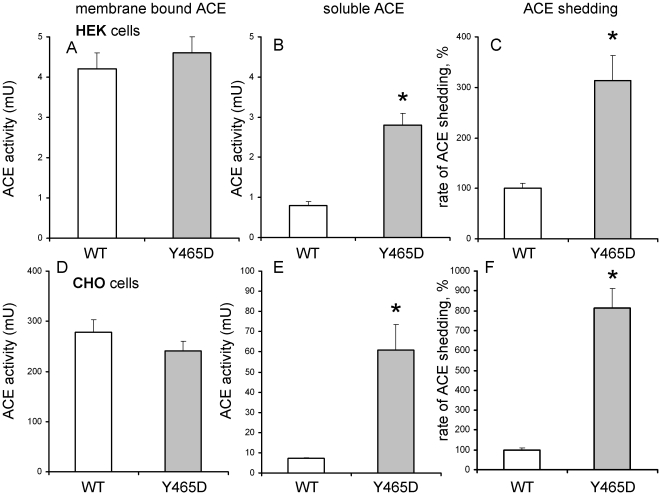
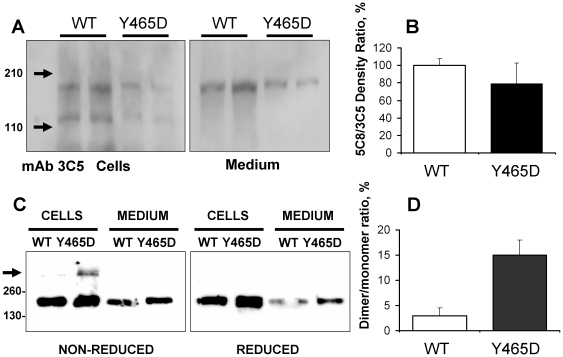
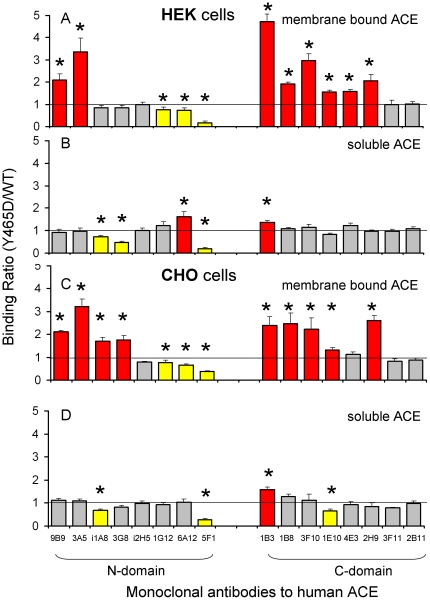
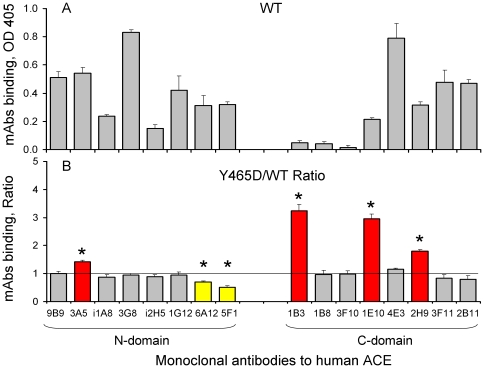
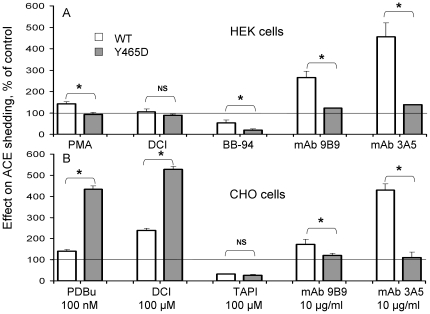
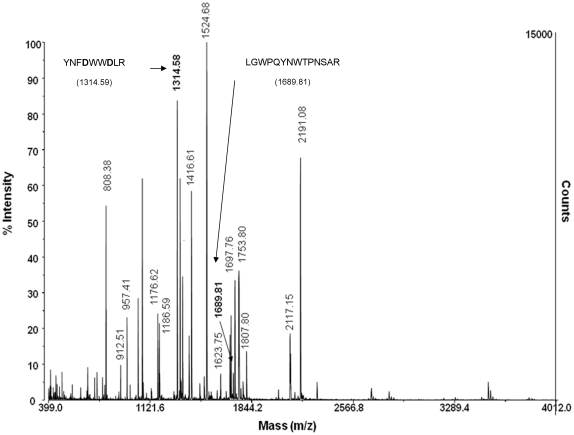
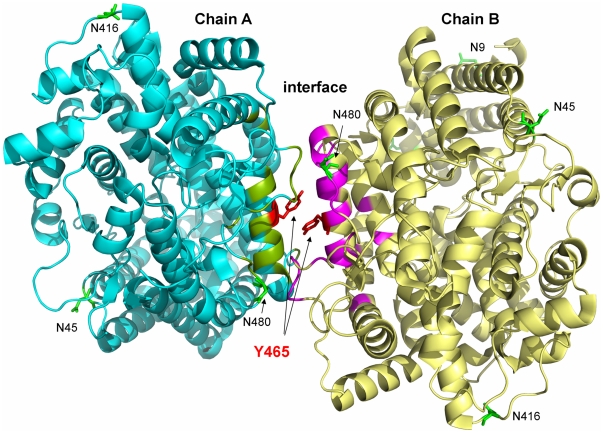
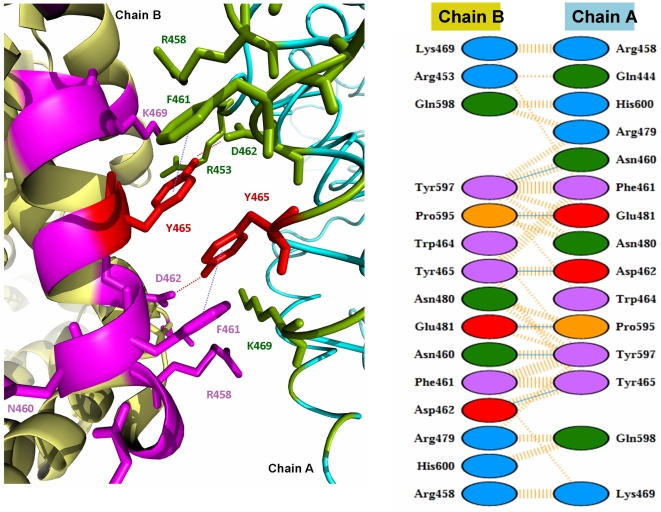
Methodology/principal findings: HEK and CHO cells expressing mutant (Tyr465Asp) ACE demonstrate a 3- and 8-fold increase, respectively, in the rate of ACE shedding compared to wild-type ACE. Conformational fingerprinting of mutant ACE demonstrated dramatic changes in ACE conformation in several different epitopes of ACE. Cell ELISA carried out on CHO-ACE cells also demonstrated significant changes in local ACE conformation, particularly proximal to the stalk region. However, the cleavage site of the mutant ACE--between Arg1203 and Ser1204--was the same as that of WT ACE. The Y465D substitution is localized in the interface of the N-domain dimer (from the crystal structure) and abolishes a hydrogen bond between Tyr465 in one monomer and Asp462 in another.

Conclusions/significance: The Y465D substitution results in dramatic increase in the rate of ACE shedding and is associated with significant local conformational changes in ACE. These changes could result in increased ACE dimerization and accessibility of the stalk region or the entire sACE, thus increasing the rate of cleavage by the putative ACE secretase (sheddase).


Conflict of interest statement

Competing Interests: The authors have declared that no competing interests exist.

Figures

Figure 1
Figure 1. The rate of mutant ACE shedding.
A,D. Cell-associated ACE activity. Lysates from thoroughly washed cell monolayers from 35 mm culture dishes were prepared using Triton X-100 as detergent. Membrane-bound ACE activity was determined fluorimetrically with Z-Phe-His-Leu as a substrate and expressed as the total mU in each sample and is the mean+SD of four experiments performed in du- or triplicates. B,E. Soluble (secreted) ACE activity. The ACE activity in the culture medium of ACE expressing cells from which the cell pellets were used in part A, D was determined fluorimetrically as above. C,F. Rate of ACE secretion. The rate of ACE cleavage was determined as the ratio between ACE in the culture medium and the sum of cell-associated and secreted ACE. Data are expressed as a percentage from the mean of WT ACE.
Figure 2
Figure 2. Western blot analysis of normal and mutant ACEs.
A. The lysates and culture medium of HEK cells expressing WT and mutant (Y465D) ACE (normalized by equal ACE activity loading −5 mU/ml) were subjected to SDS-PAGE (7.5% gel) in reducing conditions for Western blotting with mAbs 3C5 and 5C8 recognizing different sequential epitopes on the C domain of ACE –. Proteins transferred on PVDF-Plus membrane were revealed with 2 µg/ml of indicated mAb. Molecular weight markers are shown by arrows on the left of panel A, which is a representative experiment. B. Revelation of WT and mutant ACE presented in panel A (with mAb 3C5) and with mAb 5C8 (not shown) was quantified by densitometry of the bands. Data presented as a ratio of density with mAb 5C8 to that with mAb 3C5 by the image analysis (densitometry) using ImageJ software (NIH). Data are expressed as mean ± SD of 3 independent experiments. C. Western blot analysis was performed on total cell lysate and concentrated medium from CHO cells transfected with WT and ACE-Y465D. Samples were separated by 6% SDS-PAGE in the presence (right) or absence (left) of 2-mercaptoethanol. Immunoblotting was performed and ACE was detected with the C domain-specific mAb 1D8 . D. Densitometric analysis of cell lysates separated by Western blot, calculated as the percentage dimer of monomer (D/M). Data is the mean ± SD of samples prepared in duplicate.
Figure 3
Figure 3. Conformational fingerprint of mutant ACE.
A–D. Precipitation of ACE activity from cell lysates (membrane-bound form) and culture medium (soluble form) from HEK and CHO cells expressing WT and mutant (Y465D) ACE was estimated using 16 mAbs to the epitopes localized on the N and C domains of human ACE. Samples were equilibrated according to 5 mU/ml of the ACE activity with Hip-His-Leu as a substrate and incubated with a wells on the microtiter plate covered by mAbs to ACE via goat-anti-mouse IgG; then precipitated ACE activity was quantified by fluorimetric assay - plate precipitation assay . Data are expressed as a ratio of ACE activity precipitated by different mAbs from mutant ACE to that of WT ACE. Data presented as a mean of 3–4 independent determinations in duplicate. * p<0.05 indicates ratio shown is significantly different from 1. mAbs showing significant changes in binding compared to WT are colored (red: increase >20%, yellow: decrease >20%).
Figure 4
Figure 4. Binding of mAbs to mutant ACE on the surface of CHO cells (Cell ELISA).
Cell ELISA assay was performed on CHO cells expressing WT and mutant (Y465D) ACE using the panel of 16 mAbs directed to different epitopes on the N- and C domains of human ACE. A. Binding of mAbs to WT ACE determined via secondary Ab - anti-mouse IgG conjugated to peroxidase - optical density at 405 nm. Non-specific binding of the secondary mAbs to control non-immune mouse IgG was subtracted. B. Data are expressed as a percentage of mAbs binding to surface of CHO cells expressing mutant ACE to that expressing WT ACE and normalized for surface ACE expression. Data presented as a mean of 3–4 independent determinations in duplicate. mAbs showing significant changes in binding compared to WT are colored (red- increase >20%, yellow-decrease >20%). * p<0.05 indicates ratio shown is significantly different from 1.
Figure 5
Figure 5. Epitope mapping of human sACE using EM-based model.
Model of human sACE was generated using an EM-based model of porcine sACE . Epitopes localization (colored spots) were taken from the following publications , –.. Relevant amino acid residues in the ectodomain and juxtamembrane region of ACE and a cartoon of the membrane-bound ACE secretase are indicated: Leu1 and Asp616-N terminal residues of the N- and C-domains, respectively; Pro1193 –the last amino acid residues seen in the 3D structure of C domain; Pro1199 – localization of P1199L mutation causing 5-fold increase in blood ACE levels ; Arg1203-C-terminal amino acid residue of soluble ACE ; Val1228-Ser1248-transmembrane domain ; Ser1277-C-terminal amino acid residue of full-length somatic ACE .
Figure 6
Figure 6. Stimulation and inhibition of mutant (Y465D) shedding.
A. HEK cells expressing WT and mutant (Y465D) ACE were incubated in serum-free basal medium containing phorbol-12-myristate-13-acetate (PMA), 3,4-dichloroisocoumarin (DCI), the hydroxamic acid-based matrix metalloprotease inhibitor, batimastat (BB-94) or with ACE mAbs (9B9 or 3A5) for 24 hours. B. CHO cells expressing WT and mutant (Y465D) ACE were incubated in minimal medium containing phorbol 12,13-dibutyrate (PDBu), DCI, tumour necrosis factor-α protease inhibitor (TAPI) or with ACE mAbs (9B9 or 3A5) for four hours. Shedding was calculated as described in Figure 1. Data is the mean ± SD of two experiments performed in duplicate. A two-way ANOVA was performed for untreated versus treated for each cell line and indicated as * p<0.01.
Figure 7
Figure 7. MALDI TOF/TOF spectrum of mutant (Y465D) ACE after tryptic digest.
An in-gel tryptic digest was performed on mutant (Y465D) ACE, the cysteines were protected using iodoacetamide, and the total digest subjected to MALDI TOF/TOF using the matrix α-cyano-4-hydroxycinmanic acid. Masses corresponding to predicted ACE peptides are labeled. The masses corresponding to peptide containing Y465D and the C-terminal cleavage peptide are indicated in bold.
Figure 8
Figure 8. Dimer of N domain of ACE.
The dimer of the N domain was shown based on the structure of the N domain with N-domain specific inhibitor RXP407 - PDB accession # 3NXQ. The interface between monomers A (cyan) and B (yellow) is highlighted in green and magenta. Y465 is highlighted in red. N9, N45, N416, and N480 (glycosylation sites) are rendered in green.
Figure 9
Figure 9. Dimer interactions observed at the interface of N domain.
A. X-ray model showing all the residues at the interface. The color scheme is the same as in Fig. 8. Hydrogen bonds and non-covalent interactions between Y465 (red) and other residues are shown by dashed lines. B. A schematic representation of the protein-protein interactions at the dimer interface identified by PDBSum [http://www.ebi.ac.uk/pdbsum/]. The residues and their interactions are colored using the following notation: hydrogen bonds –blue+dashed lines, non-bonded contacts - dashed lines, positive residues - blue, negative residues - red, neutral residues - green, proline residues - orange, aromatic residues – magenta. Y465 is involved in a hydrogen bond with D462 and hydrophobic non-bonded interaction with F461.
Figure 10
Figure 10. A putative model of an ACE dimer attached to cell membrane.
The yellow and red “dumbbells” correspond to the EM model of porcine ACE. ACE monomers A (red) and B (yellow) are oriented such that they form a “back-to-back” complex. The N domain is rendered grey, C domain – beige.

Similar articles

Cited by

References

    1. Ehlers MWR, Riordan JF. Angiotensin-converting enzyme: new concepts concerning its biological role. Biochemistry. 1989;8:5311–5318. - PubMed
    1. Skidgel RA, Erdos EG. Biochemistry of angiotensin I- converting enzyme. In: Robertson JIS, Nichols MG, editors. The Renin-Angiotensin System. Glower Medical Publishing, New York; 1993. pp. 10.1–10.10.
    1. Corvol P, Eyries M, Soubrier F. Peptidyl-dipeptidase A/Angiotensin I-converting enzyme. In: Barret A, Rawlings N, Woessner J, editors. Handbook of Proteolytic Enzymes. Elsevier Academic Press. New York; 2004. pp. 332–349.
    1. Bernstein KE, Xiao HD, Frenzel K, Li P, Shen XZ, et al. Six truisms concerning ACE and the renin-angiotensin system educed from the genetic analysis of mice. Circ Res. 2005;96:1135–1144. - PubMed
    1. Caldwell PR, Seegal BC, Hsu KC, Das H, Soffer RL. Angiotensin-converting enztme: vascular endothelial localization. Science. 1976;191:1050–1051. - PubMed

Publication types

MeSH terms