. 2011;6(10):e25999.
doi: 10.1371/journal.pone.0025999. Epub 2011 Oct 5.

A system for performing high throughput assays of synaptic function

Affiliations

A system for performing high throughput assays of synaptic function

Chris M Hempel et al. PLoS One. 2011.

Abstract

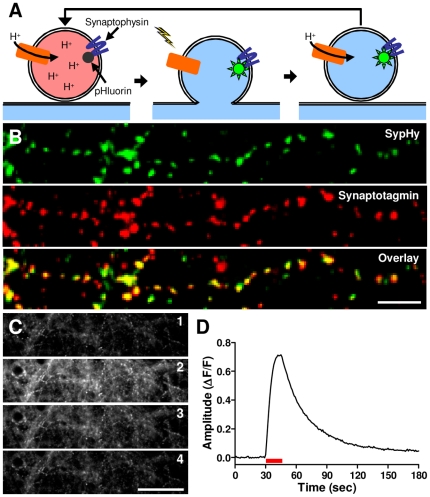
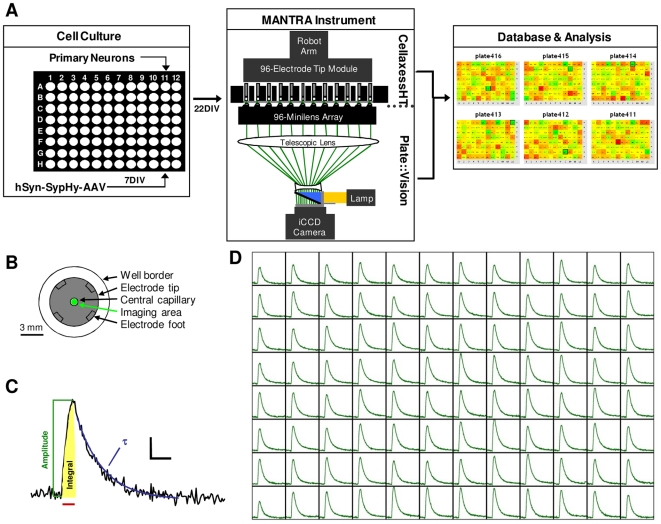
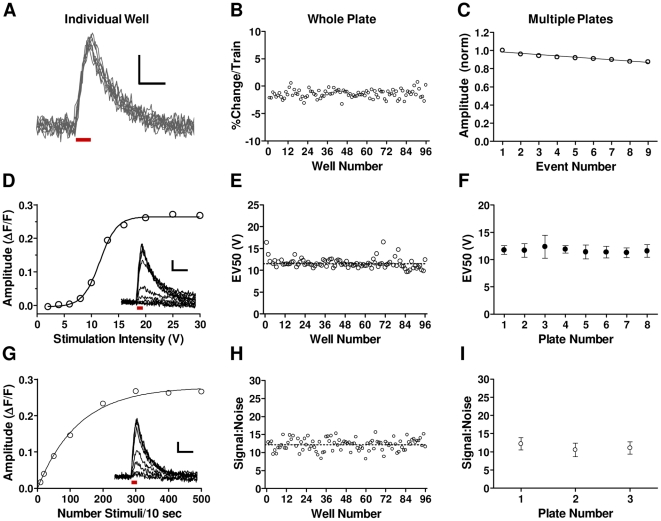
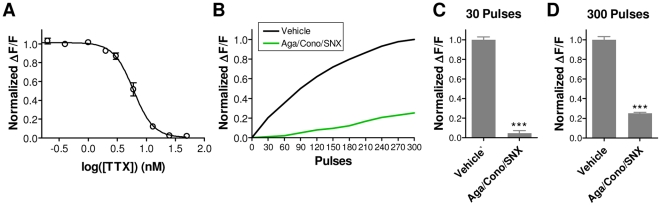
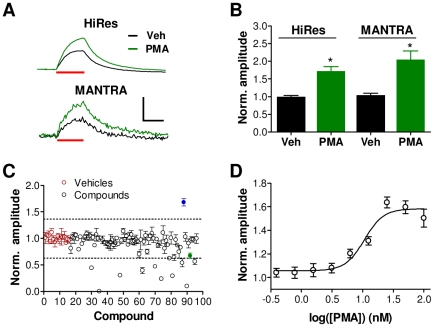
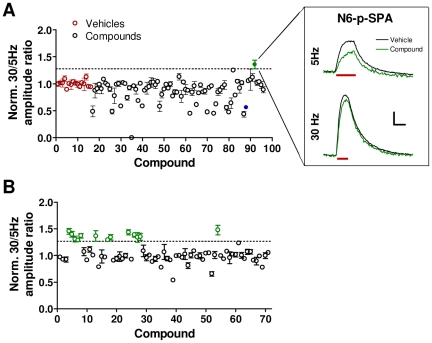
Unbiased, high-throughput screening has proven invaluable for dissecting complex biological processes. Application of this general approach to synaptic function would have a major impact on neuroscience research and drug discovery. However, existing techniques for studying synaptic physiology are labor intensive and low-throughput. Here, we describe a new high-throughput technology for performing assays of synaptic function in primary neurons cultured in microtiter plates. We show that this system can perform 96 synaptic vesicle cycling assays in parallel with high sensitivity, precision, uniformity, and reproducibility and can detect modulators of presynaptic function. By screening libraries of pharmacologically defined compounds on rat forebrain cultures, we have used this system to identify novel effects of compounds on specific aspects of presynaptic function. As a system for unbiased compound as well as genomic screening, this technology has significant applications for basic neuroscience research and for the discovery of novel, mechanism-based treatments for central nervous system disorders.


Conflict of interest statement

Competing Interests: The authors have read the journal's policy and have the following conflicts: CMH, JML, DMR, BL, ACS, EX, DJG, and JRC are employees of Galenea Corp. TAR is a consultant of Galenea Corp. MS is a former employee of Galenea Corp. This does not alter the authors' adherence to all the PLoS ONE policies on sharing data and materials.

Figures

Figure 1
Figure 1. SypHy delivered by AAV transduction as a reporter of presynaptic function.
(A) Schematic illustrating the function of the sypHy reporter of synaptic vesicle cycling. (B) Presynaptic localization of sypHy in neuronal cultures infected with hSyn-sypHy-AAV at 7 days in vitro (DIV) and fixed at 22 DIV shown by colocalization of anti-GFP (green) and anti-synaptotagmin I (red) immunoreactivity. Scale bar: 10 µm. (C) Portion of a kinetic fluorescence image series of an hSyn-sypHy-AAV infected culture prior to stimulation (1), during delivery of a 50 Hz, 10 second stimulus train (2), 30 sec after offset of stimulus train (3), and 2 min after offset of stimulus train (4). Scale bar: 50 µm. (D) Relative fluorescence intensity of the entire imaging field from the experiment shown in (c). Red bar indicates the stimulus.
Figure 2
Figure 2. The MANTRA system.
(A) Schematic depicting the MANTRA system, including the cell culture system, the reporter system, the instrumentation, and the heatmap application of the data analysis system. (B) Schematic depicting the relative dimensions of an electrode tip and the imaging area within a single well of a 96-well plate. (C) Representative sypHy fluorescence trace from a single well when stimulated as in (D) showing three of the basic waveform features automatically extracted by the MANTRA system analysis software. Red bar indicates stimulus. Scale bar: 0.05 ΔF/F, 20 sec. (D) Representative dataset from the MANTRA system showing sypHy fluorescence responses to a 50 Hz, 15 sec stimulus train from all wells of a 96-well plate. For each well, y-axis: 0.35 ΔF/F, x-axis: 180 sec.
Figure 3
Figure 3. Validation of the MANTRA system technical performance.
(A) Superimposed traces from nine successive 10 Hz, 10 sec trains from a single well. Bar indicates stimulus. Scale bars: 0.05 ΔF/F, 20 sec. (B) Amplitudes from all wells of a plate were calculated for the nine trains and normalized to the first train. Shown is the mean percent change per train for each well. Amplitude change per train for all wells was −1.5±0.97% (mean ± SD). (C) Normalized amplitudes (mean ± SD) to each train for three plates. Data were fit by linear regression (slope = −0.014; r2 = 0.93; p<0.0001). Amplitude change per train across plates was −1.5±0.13% (mean ± SEM; n = 3). (D) Amplitudes of responses to 30 Hz, 10 sec trains delivered at increasing voltages from a representative well. Data were fit with a sigmoid function (R2 = 0.99). Inset: Individual traces. Scale bar: 0.05 ΔF/F, 30 sec. Bar indicates stimulus. (E) The voltage generating the 50% peak response (EV50) for each well of a plate (%CV = 9.8%). (F) The EV50 (mean ± SD) from all wells of multiple plates stimulated as in (e). (G) Amplitudes from a well stimulated with 10 sec trains of increasing frequencies. Data were fit with a one-phase exponential curve (R2 = 0.99). Inset: Individual traces. Scale bar: 0.05 ΔF/F, 30 sec. Bar indicates the stimulation. (H) Signal:noise for responses to the 50 pulse train (mean ± SD: 12.2±1.7) for a plate. “Signal” is amplitude. “Noise” is the standard deviation of a 10 second baseline. (I) Signal:noise (mean ± SD) data generated from a 50 pulse train from three plates.
Figure 4
Figure 4. MANTRA system responses depend on action potential-mediated opening of presynaptic Ca++ channels.
(A) TTX concentration-response curve for response amplitudes to a 30 Hz, 10 sec pulse train from a single plate. Each point shows the mean ± SEM of 8 wells normalized to within-plate vehicle controls. Data were fit with a standard sigmoid concentration-response function (R2 = 0.99). (B) SypHy fluorescence responses during a 30 Hz, 10 second stimulus train in the presence of the Cav2.1 inhibitor ω-agatoxin IVA (500 nM), the Cav2.2 inhibitor ω-conotoxin GVIA (1 µM), and the Cav2.3 inhibitor SNX-482 (1.2 µM). The waveforms depicted are an average of 24 wells for the vehicle and 8 wells for the treatment group. (C,D) Amplitudes (mean ± SEM) of the sypHy responses shown in (B) following (C) 30 pulses (1 sec) and (D) 300 pulses (10 sec) of the stimulus train (***: p<0.0001).
Figure 5
Figure 5. The MANTRA system can detect modulators of synaptic vesicle cycling.
(A) SypHy traces from neuronal cultures treated with PMA (1 µM) or vehicle (0.7% DMSO) generated with the high resolution microscope system (HiRes) or the MANTRA system in response to a 5 Hz, 30 sec stimulus train. Scale bar: 0.1 ΔF/F, 20 sec. (B) Vehicle-normalized amplitudes (mean ± SEM) in response to the 5 Hz, 30 sec stimulus train in vehicle- and PMA-treated cultures measured on the microscope based system (HiRes; n = 3) and on the MANTRA system, for which statistics were generated from three randomly selected PMA- and vehicle-treated replicates. (C) The plate of the LOPAC library containing PMA was screened in triplicate on the MANTRA system (10 µM; 1 hour incubation) using a stimulation protocol consisting of a 5 Hz, 30 sec train, a 10 Hz, 30 sec train, and a 30 Hz, 15 sec train with stimulation trains separated by 5 minute intervals. Shown are the amplitudes (mean ± SEM) of the three replicates for each compound normalized to the mean amplitude of the vehicle wells. Dotted lines indicate three standard deviations from the vehicle mean. Red points indicate vehicle wells, blue point indicates PMA. Green point indicates N6-phenyladenosine as further described in Figure 6. (D) PMA concentration-response curve for response amplitudes to the 5 Hz train generated from a single plate. Each point shows the mean ± SEM of 8 wells normalized to within-plate vehicle controls. Data were fit with a standard sigmoid concentration-response function (R2 = 0.95).
Figure 6
Figure 6. High frequency stimulation overcomes adenosine A1 agonist-induced suppression of synaptic vesicle release.
(A) The ratio of the amplitudes of the responses to the 30 Hz train to amplitudes of the responses to the 5 Hz train was determined for the compounds from the LOPAC plate described in Figure 5C. The depicted data (mean ± SEM) were normalized to the mean of the vehicle control wells. Dashed line indicates three standard deviations from the mean of the vehicles. Red points indicate vehicle wells. Blue point indicates PMA. Green point indicates N6-phenyladenosine. Inset shows the average waveforms from the three replicates of N6-phenyladenosine and the 36 vehicle replicates from the three replicate screening plates. Red bars indicate periods of stimulation Scale bar: 0.05 ΔF/F, 20 sec. (B) A single plate of compounds targeting adenosine and purine receptors (Enzo Life Sciences) was screened as described in Figure 5C. Data are as described in (A). Green circles indicate compounds that generated effects greater than three standard deviations from the mean of the vehicles.

References

    1. St Johnston D. The art and design of genetic screens: Drosophila melanogaster. Nat Rev Genet. 2002;3:176–188. - PubMed
    1. Forsburg SL. The art and design of genetic screens: yeast. Nat Rev Genet. 2001;2:659–668. - PubMed
    1. Schena M, Shalon D, Davis RW, Brown PO. Quantitative monitoring of gene expression patterns with a complementary DNA microarray. Science. 1995;270:467–470. - PubMed
    1. Persidis A. High-throughput screening. Advances in robotics and miniturization continue to accelerate drug lead identification. Nat Biotechnol. 1998;16:488–489. - PubMed
    1. Maycox PR, Kelly F, Taylor A, Bates S, Reid J, et al. Analysis of gene expression in two large schizophrenia cohorts identifies multiple changes associated with nerve terminal function. Mol Psychiatry. 2009;14:1083–1094. - PubMed

Publication types