. 2011 Nov 23;133(46):18966-74.
doi: 10.1021/ja2082813. Epub 2011 Oct 31.

Transient, sparsely populated compact states of apo and calcium-loaded calmodulin probed by paramagnetic relaxation enhancement: interplay of conformational selection and induced fit

Affiliations

Transient, sparsely populated compact states of apo and calcium-loaded calmodulin probed by paramagnetic relaxation enhancement: interplay of conformational selection and induced fit

Nicholas J Anthis et al. J Am Chem Soc. .

Abstract

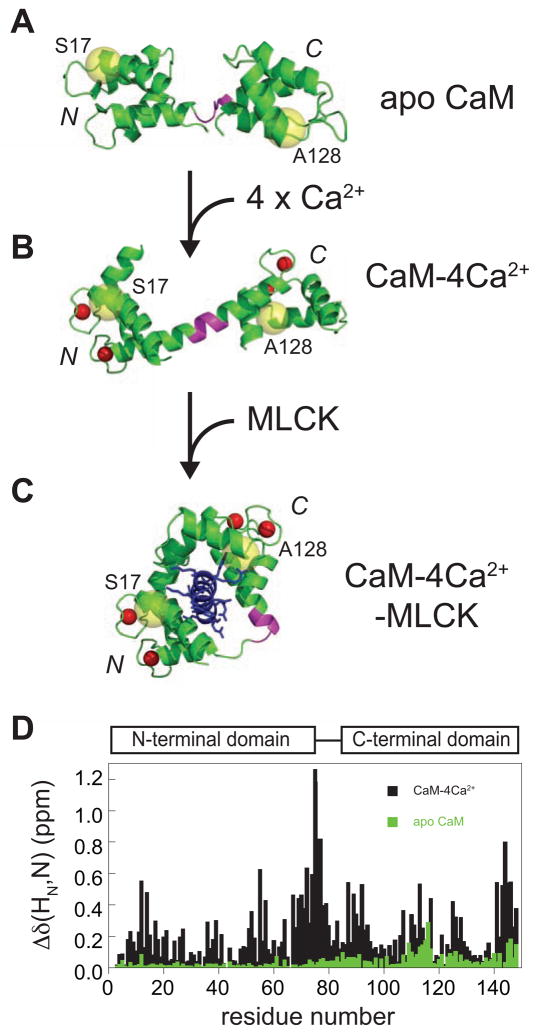
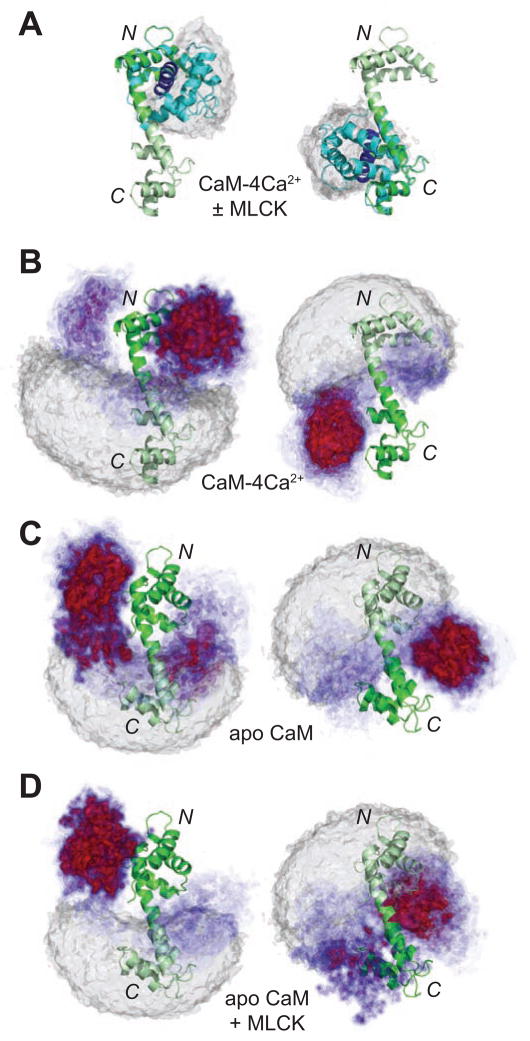
Calmodulin (CaM) is the universal calcium sensor in eukaryotes, regulating the function of numerous proteins. Crystallography and NMR show that free CaM-4Ca(2+) exists in an extended conformation with significant interdomain separation, but clamps down upon target peptides to form a highly compact structure. NMR has revealed substantial interdomain motions in CaM-4Ca(2+), enabled by a flexible linker. In one instance, CaM-4Ca(2+) has been crystallized in a compact configuration; however, no direct evidence for transient interdomain contacts has been observed in solution, and little is known about how large-scale interdomain motions contribute to biological function. Here, we use paramagnetic relaxation enhancement (PRE) to characterize transient compact states of free CaM that are too sparsely populated to observe by traditional NMR methods. We show that unbound CaM samples a range of compact structures, populated at 5-10%, and that Ca(2+) dramatically alters the distribution of these configurations in favor of states resembling the peptide-bound structure. In the absence of Ca(2+), the target peptide binds only to the C-terminal domain, and the distribution of compact states is similar with and without peptide. These data suggest an alternative pathway of CaM action in which CaM remains associated with its kinase targets even in the resting state. Only CaM-4Ca(2+), however, shows an innate propensity to form the physiologically active compact structures, suggesting that Ca(2+) activates CaM not only through local structural changes within each domain but also through more global remodeling of interdomain interactions. Thus, these findings illustrate the subtle interplay between conformational selection and induced fit.


Figures

Fig. 1
Fig. 1. CaM structures and peptide interactions
(A–C) Structures of CaM in various physiological states. Ca2+ ions are shown as red spheres, and spin-labeling sites S17C and A128C are indicated by yellow spheres. The flexible linker (residues 77-81) is shown in magenta. (A) NMR structure of apo CaM (PDB 1CFD). (B) Crystal structure of CaM-4Ca2+ (PDB 1CLL) in the extended dumbbell conformation with a continuous central helix. (C) Crystal structure of the CaM-4Ca2+-MLCK complex (PDB 1CDL). (D) Weighted combined 1HN/15N chemical shift perturbations, Δδ(HN,N), for the backbone amide groups of apo CaM (green) or CaM-4Ca2+ (black) upon saturation with MLCK peptide.
Fig. 2
Fig. 2. PRE profiles
(A,B) PRE profiles for CaM with a spin-label at (A) S17C or (B) A128C. Experimental PRE profiles for apo or Ca2+-loaded CaM, in the presence or absence of MLCK peptide, are shown as circles (error bar, 1 s.d.). PREs too large (> 80 s−1, roughly) to be accurately measured are plotted at the top of the charts. PRE profiles back-calculated from the structures of CaM-4Ca2+-MLCK (red), CaM-4Ca2+ (blue) and apo CaM (green) are shown as solid lines. Only for the CaM-4Ca2+-MLCK complex are the experimental interdomain PREs correctly predicted by the corresponding known structure. Note that slightly different PRE profiles can be back-calculated from the same structure depending on which experimental intradomain PRE data set is used to fit the spin-label position (and, in the case of CaM-4Ca2+-MLCK, whether the peptide is present—as in the top panel—which slightly restricts the conformational space available to the spin-label). In the case of A128C, the apo NMR structure predicts some small PREs at the N-terminus; these are likely artifacts of the specific conformation adopted by the deposited average regularized structure (PDB 1CFD) since no interdomain NOEs were observed in that study.
Fig. 3
Fig. 3. Ionic strength dependence of CaM-Ca2+ PREs
Experimental PREs (circles, error bars = 1 s.d.) were measured for CaM-4Ca2+ with the nitroxide spin label at (A) S17C and (B) A128C at various ionic strengths. Intradomain PREs are shown in the left panels and interdomain PREs in the right panels. The data are presented as scatter plots with the PRE value at 0 mM KCl shown on the x-axis and the PRE value at 100 mM (red) and 200 mM (blue) shown on the y-axis. In each case, the slope of a best-fit line through the origin is given. A dashed line corresponding to a slope of m = 1 is also displayed for reference. The intradomain PREs do not depend on ionic strength, but increasing the salt concentration significantly decreases the magnitude of the interdomain PREs, indicating that the interdomain interactions explored have a significant electrostatic component.
Fig. 4
Fig. 4. PRE-driven ensemble simulated annealing calculations characterizing the minor closed states of CaM with interdomain contacts
(A,B) Dependence of the interdomain PRE Q-factor for S17C (blue) and A128C (green) as a function of (A) minor state population (using an 8-member ensemble) and (B) ensemble size (for a minor state population of 10%) for CaM-4Ca2+, apo CaM, and apo CaM + MLCK peptide. (C,D) The resulting fits to the PRE profiles for (C) S17C and (D) A128C for a minor state population of 10% represented by an 8-member ensemble (calculated, magenta lines; experimental, black circles; error bars, 1 s.d.).
Fig. 5
Fig. 5. Visualizing the minor closed-state ensembles of CaM-4Ca2+ and apo CaM
(A) CaM-4Ca2+-MLCK complex (with CaM in cyan and MLCK peptide in blue) overlaid on the CaM-4Ca2+ dumbbell structure (green), best-fitted to either the N-terminal (left panel) or C-terminal (right panel) domains. Twenty-six additional peptide-bound structures were overlaid in the same manner, and these are represented by the atomic probability density maps shown in grey for the C-terminal domain (left) and N-terminal domain (right). These structures (PDB codes 1CDL, 1CDM, 1MXE, 1NIW, 1QS7, 1QTX, 1VRK, 1YR5, 1ZUZ, 2BE6, 2F3Y, 2F3Z, 2FOT, 2HQW, 2O5G, 2O60, 2VAY, 3BXL, 3BYA, 3DVE, 3DVJ, 3DVK, 3DVM, 3EWT, 3EWV, 3GP2) represent a wide array of different 1:1 canonical CaM-peptide complexes, but it can be seen that the conformational space occupied by the two domains is very similar to that in the CaM-4Ca2+-MLCK complex. (B–D) Atomic probability density maps showing the conformational space sampled by the minor species ensemble for (B) CaM-4Ca2+, (C) apo CaM, and (D) the apo CaM-MLCK complex. The minor state atomic probability maps are derived from 100 independent PRE-driven simulated annealing calculations using an 8-member ensemble (i.e. 800 total structures) at a population of 10%, and plotted at multiple contour levels ranging from 0.1 (transparent blue) to 0.5 (opaque red). The gray probability density maps, plotted at a single contour level of 0.1 of maximum, show the conformational space consistent with interdomain PRE values ≤ 2 s−1 and represent the major state ensemble characterized by no interdomain contacts and an occupancy of ~90% (see also Fig. S9A). In the left-hand panels, all ensemble members are best-fitted to the N-terminal domain (dark green) and the probability density maps are shown for the C-terminal domain. In the right-hand panels, all ensembles are best-fitted to the C-terminal domain (dark green) and the probability density maps are shown for the N-terminal domain. All panels are displayed in the same orientation, and the extended dumbbell structure is displayed as a ribbon diagram for reference (with the structures of the individual domains in panels C and D replaced by those for apo CaM).

References

    1. Yamniuk AP, Vogel HJ. Mol Biotechnol. 2004;27:33–57. - PubMed
    1. Kuboniwa H, Tjandra N, Grzesiek S, Ren H, Klee CB, Bax A. Nature Struct Biol. 1995;2:768–776. - PubMed
    1. Chattopadhyaya R, Meador WE, Means AR, Quiocho FA. J Mol Biol. 1992;228:1177–1192. - PubMed
    1. Meador WE, Means AR, Quiocho FA. Science. 1992;257:1251–1255. - PubMed
    1. Zhang M, Tanaka T, Ikura M. Nature Struct Biol. 1995;2:758–767. - PubMed

Publication types