Comparative Study
. 2011 Oct 14:10:92.
doi: 10.1186/1475-925X-10-92.

A novel technique for fetal heart rate estimation from Doppler ultrasound signal

Affiliations
Comparative Study

A novel technique for fetal heart rate estimation from Doppler ultrasound signal

Janusz Jezewski et al. Biomed Eng Online. .

Abstract

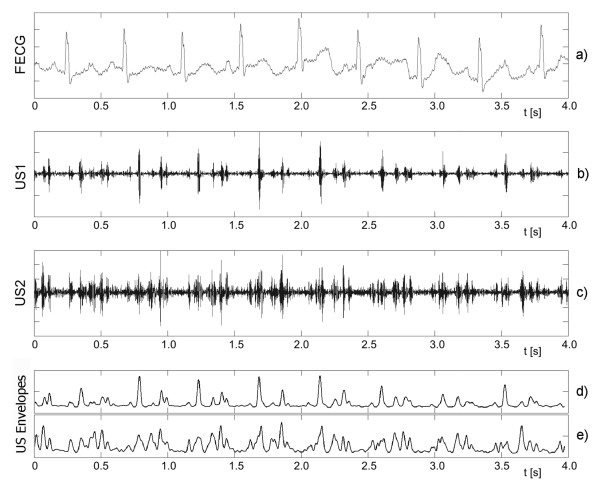
Background: The currently used fetal monitoring instrumentation that is based on Doppler ultrasound technique provides the fetal heart rate (FHR) signal with limited accuracy. It is particularly noticeable as significant decrease of clinically important feature - the variability of FHR signal. The aim of our work was to develop a novel efficient technique for processing of the ultrasound signal, which could estimate the cardiac cycle duration with accuracy comparable to a direct electrocardiography.

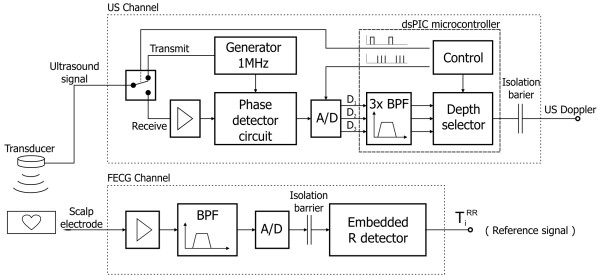
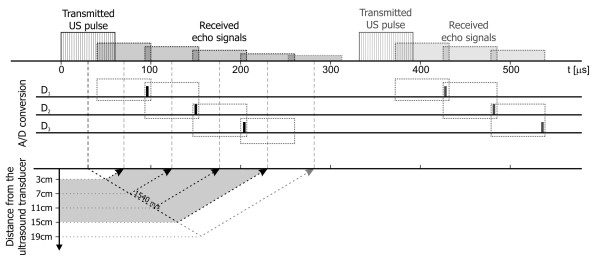
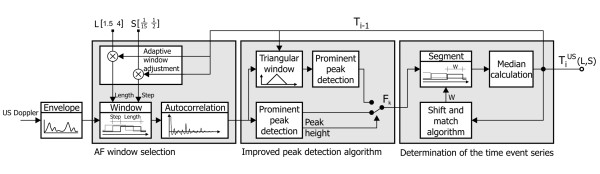
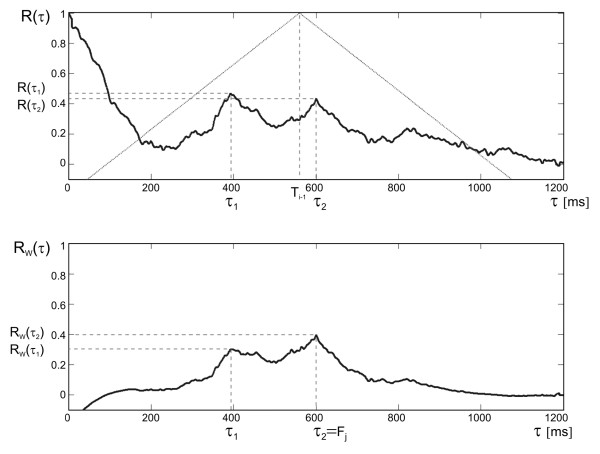
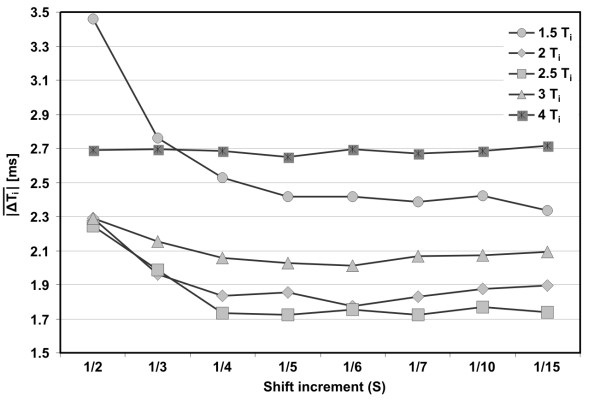
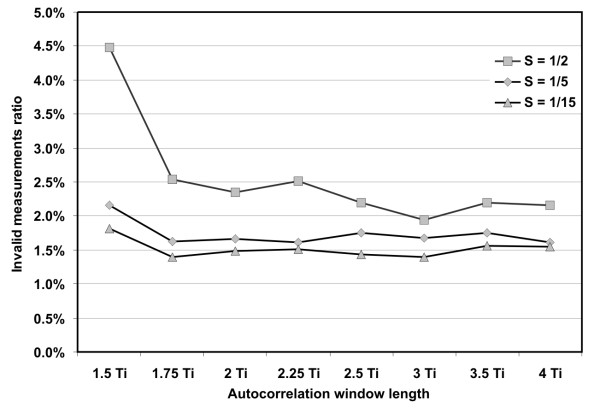
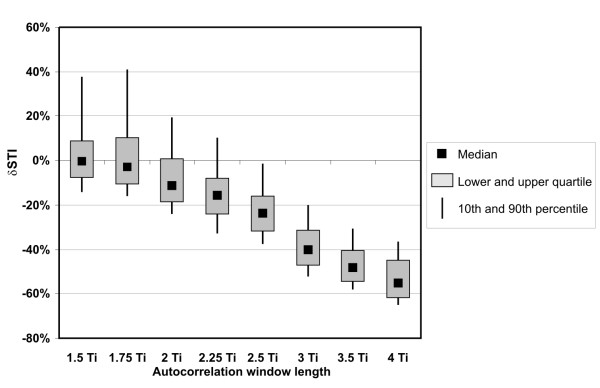
Methods: We have proposed a new technique which provides the true beat-to-beat values of the FHR signal through multiple measurement of a given cardiac cycle in the ultrasound signal. The method consists in three steps: the dynamic adjustment of autocorrelation window, the adaptive autocorrelation peak detection and determination of beat-to-beat intervals. The estimated fetal heart rate values and calculated indices describing variability of FHR, were compared to the reference data obtained from the direct fetal electrocardiogram, as well as to another method for FHR estimation.

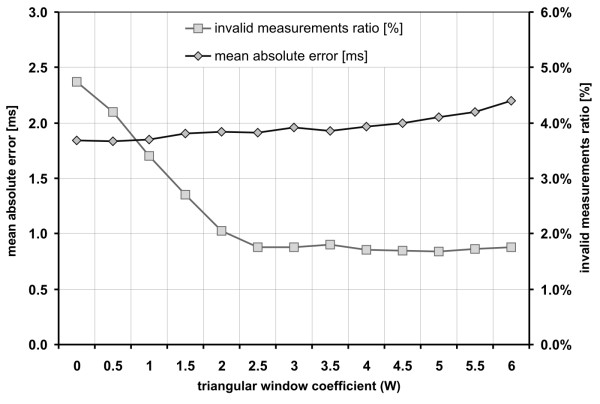
Results: The results revealed that our method increases the accuracy in comparison to currently used fetal monitoring instrumentation, and thus enables to calculate reliable parameters describing the variability of FHR. Relating these results to the other method for FHR estimation we showed that in our approach a much lower number of measured cardiac cycles was rejected as being invalid.

Conclusions: The proposed method for fetal heart rate determination on a beat-to-beat basis offers a high accuracy of the heart interval measurement enabling reliable quantitative assessment of the FHR variability, at the same time reducing the number of invalid cardiac cycle measurements.


Figures

Figure 1
Figure 1
Fetal heart activity signals. Four-second segments of the simultaneously acquired signals: a) direct electrocardiogram from an electrode placed on fetal head, b) and c) two Doppler ultrasound signals from two transducers placed separately but focused on the same fetus. Additionally, the envelopes of both Doppler signals are presented as d) and e). Both US signals differ significantly as for the number of cardiac cycle episodes being observed. The periodicity of Doppler signal is much easier to estimate in US1, but only the FECG signal enables explicit recognition of the timing of fetal cardiac events.
Figure 2
Figure 2
Instrumentation. Structure of the developed instrumentation for simultaneous acquisition of both the mechanical and electrical fetal heart activities.
Figure 3
Figure 3
Ultrasound Doppler signal acquisition technique. The reflection of acoustic wave on different depths using the pulsed Doppler method. A transmitted pulse of US wave lasting 60 μs penetrates the maternal and fetal body with an average speed of 1540 m/s. The time at which the echo is received depends on a depth of the reflecting object. The received signal is demodulated to obtain the Doppler frequencies, and then A/D converted three times during reception period to cover the depth range of interest - between 3 and 15 cm.
Figure 4
Figure 4
General scheme of the algorithm for Doppler signal processing. The final TiUS signal is a function of two parameters defining the AF: the window length (L) and the shift increment (S), both of them in relation to a cardiac cycle.
Figure 5
Figure 5
Improved peak detection algorithm. General idea of correction of the autocorrelation function using a triangular window. The upper plot presents the autocorrelation R(τ) and the triangular window (W = 1.5) centered according to the last correctly measured interval. The plot below presents the RW(τ) function obtained after correction of R(τ). The correction enables the selection of an appropriate interval value τ2 even when a false maximum R(τ1) was caused by interferences.
Figure 6
Figure 6
The influence of segmentation procedure on the beat-to-beat variability. Example showing a random selection of a starting point for our segmentation algorithm. Two situations are depicted: a) correct match between segments and instantaneous periodicity measurements, b) phase-shifted segmentation causing significant false decrease of beat-to-beat variability in the FHR signal.
Figure 7
Figure 7
Graphic illustration of the segments shift and matching method. The first picture a) presents the way in which a new cardiac cycle duration is calculated, next three b), c), d), depict the principle of correction factor determination. If the mean difference between values Fk and the corresponding values of Ti intervals decreases after the interval displacement by either γ or -γ (where γ is equal to temporary window shift increment), the correction factor should be applied into the segment duration. In that case, the last interval duration is corrected by a factor ε = γ/4 or ε = -γ/4 respectively, which can be seen in e).
Figure 8
Figure 8
Triangular window width. The chart presents the influence of triangular window parameter W on the mean absolute interval error and on the number of invalid measurements rejected during the validation stage. The TUS signal was calculated for W values varying from 0 (no windowing) to 6 (the most narrow window), while the AF window length L = 2.5 and shift increment S = 1/5.
Figure 9
Figure 9
Shift increment selection. The mean absolute error of interval measurement ΔTi¯ as a function of window shift increment S (from 1/2 to 1/15) obtained for five different lengths of AF window (1.5, 2, 2.5, 3 and 4 Ti).
Figure 10
Figure 10
Invalid measurements ratio. The relation between the AF window length and the invalid measurements ratio in the analyzed recordings. The results were obtained for S = 1/5, assumed to be the optimal shift increment, as well as for two boundary values in the range investigated.
Figure 11
Figure 11
Short-term variability error. Relationship between the autocorrelation window length and the relative error of FHR variability index calculation δSTI. The error distribution is presented as a median value, lower and upper quartiles, together with 10th and 90th percentile as a measure of dispersion.

Similar articles

Cited by

References

    1. Jezewski J, Wrobel J, Horoba K, Cholewa D, Gacek A, Kupka T, Matonia A. Monitoring of mechanical and electrical activity of fetal heart: The nature of signals. Arch Perinat Med. 2002;8:40–46.
    1. Peters M, Crowe J, Pieri JF, Quartero H, Hayes-Gill B, James D, Stinstra J, Shakespeare S. Monitoring the fetal heart non-invasively: a review of methods. J Perinat Med. 2001;29:408–416. doi: 10.1515/JPM.2001.057. - DOI - PubMed
    1. Shakespeare SA, Crowe JA, Hayes-Gill BR, Bhogal K, James DK. The information content of Doppler ultrasound signals from the fetal heart. Med Biol Eng Comput. 2001;39:619–626. doi: 10.1007/BF02345432. - DOI - PubMed
    1. Matonia A, Jezewski J, Kupka T, Wrobel J, Horoba K, Widera M. Instrumentation for fetal cardiac performance analysis during the antepartum period. Conf Proc IEEE Eng Med Biol Soc. 2005;27:6675–6678. - PubMed
    1. Hasan MA, Reaz MBI, Ibrahimy MI, Hussain MS, Uddin J. Detection and Processing Techniques of FECG Signal for Fetal Monitoring. Biol Proced Online. 2009;11:263–295. doi: 10.1007/s12575-009-9006-z. - DOI - PMC - PubMed

Publication types