Review
. 2011 Oct;8(5):591-604.
doi: 10.1586/epr.11.53.

Recent advances in single-cell MALDI mass spectrometry imaging and potential clinical impact

Affiliations
Review

Recent advances in single-cell MALDI mass spectrometry imaging and potential clinical impact

Kristin J Boggio et al. Expert Rev Proteomics. 2011 Oct.

Abstract

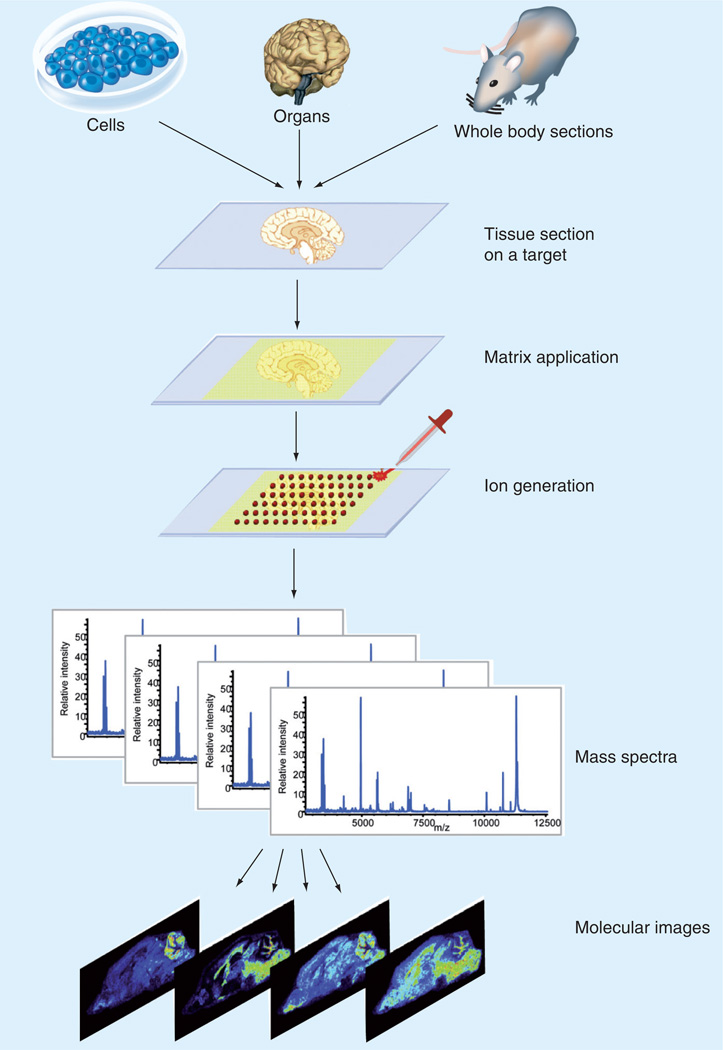
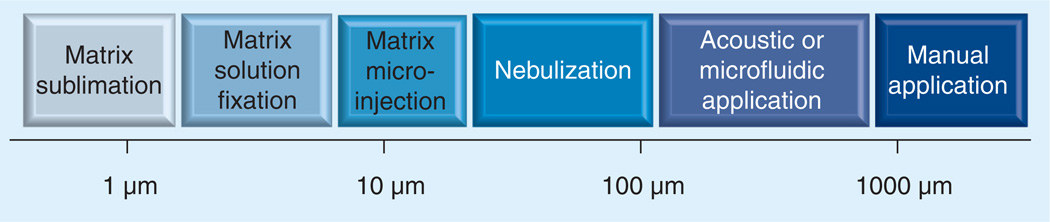
Single-cell analysis is gaining popularity in the field of mass spectrometry as a method for analyzing protein and peptide content in cells. The spatial resolution of MALDI mass spectrometry (MS) imaging is by a large extent limited by the laser focal diameter and the displacement of analytes during matrix deposition. Owing to recent advancements in both laser optics and matrix deposition methods, spatial resolution on the order of a single eukaryotic cell is now achievable by MALDI MS imaging. Provided adequate instrument sensitivity, a lateral resolution of approximately 10 µm is currently attainable with commercial instruments. As a result of these advances, MALDI MS imaging is poised to become a transformative clinical technology. In this article, the crucial steps needed to obtain single-cell resolution are discussed, as well as potential applications to disease research.


Figures

Figure 1
Figure 1. MALDI mass spectrometry imaging process
The tissue/cell of interest is placed onto a MALDI target or an indium tin oxide-coated glass slide. A matrix is applied to the tissue/cell and mass spectra are acquired in a raster pattern across the tissue section. The spatial distribution of a single m/z can be represented as a 2D ion density map. Reprinted with permission from [118].
Figure 2
Figure 2. Histological stains and mass spectrometry
(A) High-magnification (×400) photomicrographs of unstained (control) and stained 10-µm serial human glioma tissue sections. In the upper right corner of each image, the lower left edge of the matrix sample can be seen. (B) MALDI MS protein profiles acquired from unstained (Ct rinsed in 70 and 100% ethanol) and stained grade IV human glioma tissue sections. Ct: Control section; CV: Cresyl violet; MB: Methylene blue; NFR: Nuclear fast red; TB: Toluidine blue; TP: Terry’s polychrome. Reprinted with permission from [14]. © 2004 American Chemical Society.
Figure 3
Figure 3. Spatial resolution of matrix deposition methods
Reprinted from [31] with permission from Springer Science and Business Media.
Figure 4
Figure 4. Chemical treatment of tissue sections
(A) TIC variations recorded from the MALDI-TOF mass spectrometry protein profiles acquired from serial mouse liver tissue sections either not washed or washed with different solvent systems in the m/z range from 500 to 1100 (lipid component) and m/z range from 2000 to 25,000 (protein component). (B) Number of peak variations as a function of the same washes for the protein component. t-BME: Tertbutyl methyl ether; TIC: Total ion count. Reprinted with permission from [20].
Figure 5
Figure 5. Registration of a fluorescence microscopy image with anatomical atlas of a mouse brain
Fluorescence microscopy images of a sagittal brain section of a B6. Cg-Tg(Thy1-YFP)16Jrs/J mouse. Dashed white lines delineate different regions of the brain and are in the exact proportions of the anatomical boundaries of the 1.66 mm lateral sagittal section of the Mouse Brain Atlas. The degree of overlap between the experimentally determined, fluorescence-based anatomical boundaries and those of the Mouse Brain Atlas gives an estimate of location to within 1 mm. (A) M1: primary motor cortex; S1Tr: primary somatosensory cortex, trunk region; S1HL: primary somatosensory cortex, hind limb region; CPu: caudate putamen (striatum); LV: lateral ventricle; CA1–CA3: fields CA1–CA3 of the hippocampus, respectively. (B) Primary somatosensory cortex trunk region and hind limb region.
Figure 6
Figure 6. MALDI mass spectrometry of a single neuron
(A) Raw data from a positive-ion mode mass spectrum of a single motor neuron from layer V of a B6. Cg-Tg(Thy1-YFP)16Jrs/J transgenic mouse motor cortex. Inset: 5730–8030 m/z. Inset depicts complexity of sample. (B) Using a modified microinjection setup, a single neuron was labeled with MALDI matrix (sinapinic acid). Fluorescence is used to visualize the location of the matrix in conjunction with the location of the neuron. In this image, fluorescence is not observed due to the matrix that is deposited on the neuron, as visualized in (C). Scale bar is equal to 100 µm. (C) Same microscopic field as in (B), visualized with bright field microscopy. Scale bar is equal to 100 µm.
Figure 7
Figure 7. MALDI mass spectrometry of single neurons
(A) Average spectrum of 32 cortical neurons from a B6.Cg-Tg(Thy1-YFP)16Jrs/J transgenic mouse. (B) Pseudo-gel view representation of the spectra of the 32 cortical neurons that were averaged for the spectra above. All spectra were baseline subtracted using a top-hat algorithm and were not smoothed.
Figure 8
Figure 8. Sensitivity of microdeposition
(A) Maximum S/N versus microdeposition spot area. (B) Average S/N versus microdeposition spot area. Data points include samples that were transferred on both dry ice and at room temperature. S/N: Signal-to-noise ratio.

Similar articles

Cited by

References

    1. Sinha TK, Khatib-Shahidi S, Yankeelov TE, et al. Integrating spatially resolved three-dimensional MALDI IMS with in vivo magnetic resonance imaging. Nat. Methods. 2008;5(1):57–59. - PMC - PubMed
    1. McCombie G, Staab D, Stoeckli M, Knochenmuss R. Spatial and spectral correlations in MALDI mass spectrometry images by clustering and multivariate analysis. Anal. Chem. 2005;77(19):6118–6124. - PubMed
    1. Deininger SO, Ebert MP, Futterer A, Gerhard M, Rocken C. MALDI imaging combined with hierarchical clustering as a new tool for the interpretation of complex human cancers. J. Proteome Res. 2008;7(12):5230–5236. - PubMed
    1. Monroe EB, Jurchen JC, Lee J, Rubakhin SS, Sweedler JV. Vitamin E imaging and localization in the neuronal membrane. J. Am. Chem. Soc. 2005;127(35):12152–12153. - PubMed
    1. Lechene C, Hillion F, McMahon G, et al. High-resolution quantitative imaging of mammalian and bacterial cells using stable isotope mass spectrometry. J. Biol. 2006;5(6):20. - PMC - PubMed

Publication types