. 2011 Oct;4(10):1100-9.
doi: 10.1016/j.jcmg.2011.04.020.

Pioglitazone modulates vascular inflammation in atherosclerotic rabbits noninvasive assessment with FDG-PET-CT and dynamic contrast-enhanced MR imaging

Affiliations

Pioglitazone modulates vascular inflammation in atherosclerotic rabbits noninvasive assessment with FDG-PET-CT and dynamic contrast-enhanced MR imaging

Esad Vucic et al. JACC Cardiovasc Imaging. 2011 Oct.

Abstract

Objectives: We sought to determine the antiatherosclerotic properties of pioglitazone using multimethod noninvasive imaging techniques.

Background: Inflammation is an essential component of vulnerable or high-risk atheromas. Pioglitazone, a peroxisome proliferator-activated receptor-gamma agonist, possesses potent anti-inflammatory properties. We aimed to quantify noninvasively the anti-inflammatory effects of pioglitazone on atheroma using (18)F-fluorodeoxyglucose ((18)F-FDG) positron emission tomography (PET)/computed tomography (CT) and dynamic contrast-enhanced (DCE) magnetic resonance imaging (MRI).

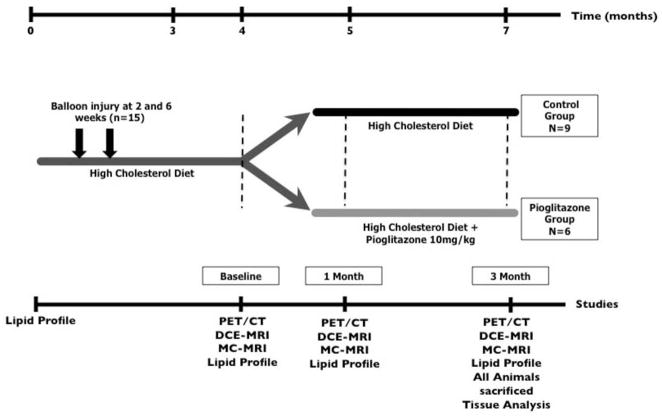
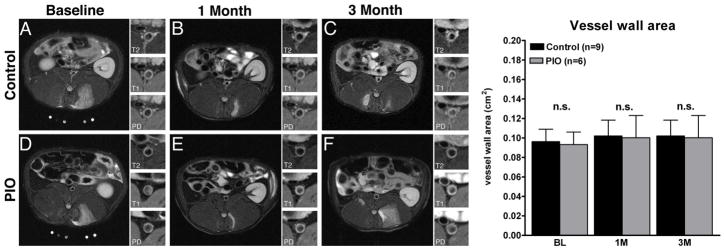
Methods: Atherosclerotic plaques were induced in the aorta of 15 New Zealand white rabbits by a combination of a hyperlipidemic diet and 2 balloon endothelial denudations. Nine rabbits continued the same diet, whereas 6 rabbits received pioglitazone (10 mg/kg orally) in addition to the diet. Twelve animals underwent (18)F-FDG-PET/CT, and 15 animals underwent DCE-MRI at baseline, 1 month, and 3 months after treatment initiation. Concomitantly, serum metabolic parameters were monitored. After imaging was completed, aortic histologic analysis and correlation analysis were performed.

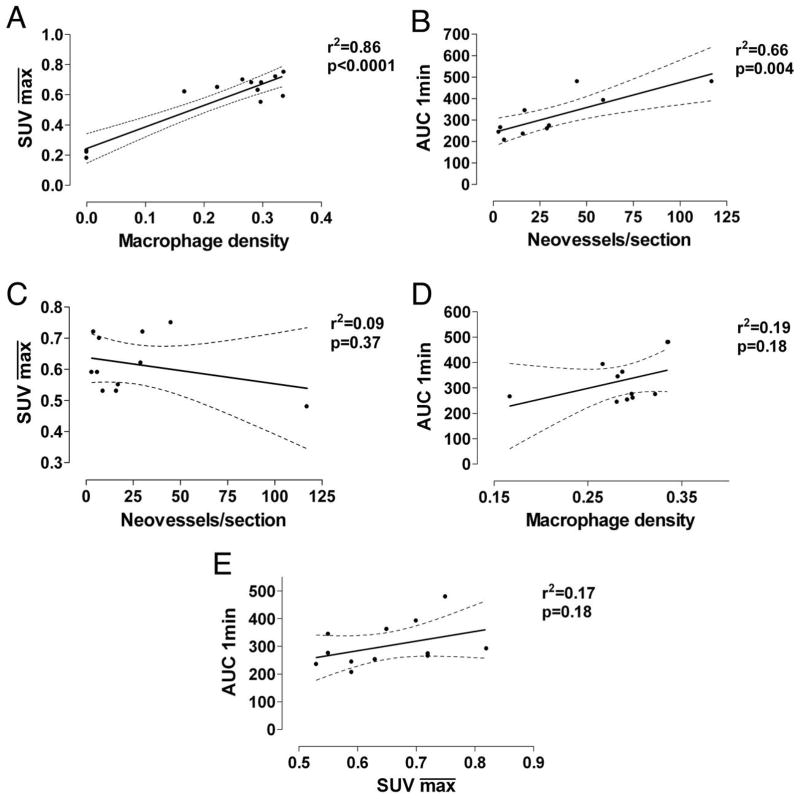
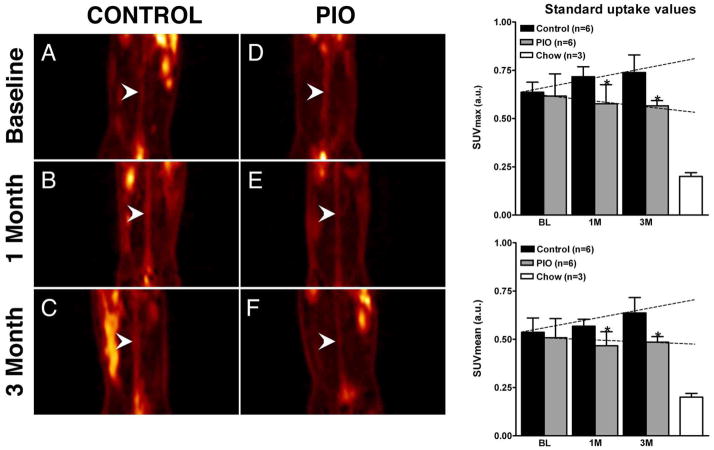
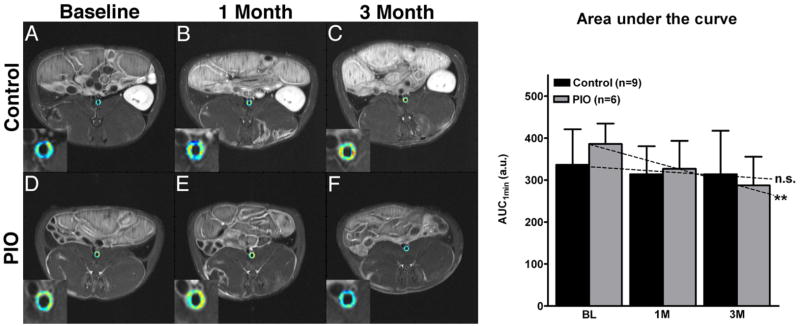
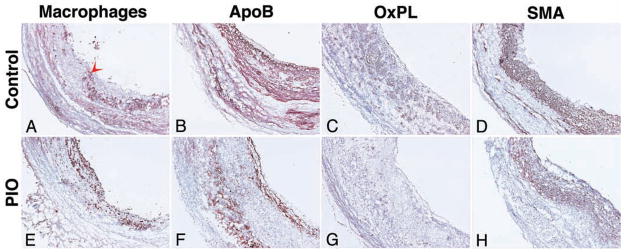
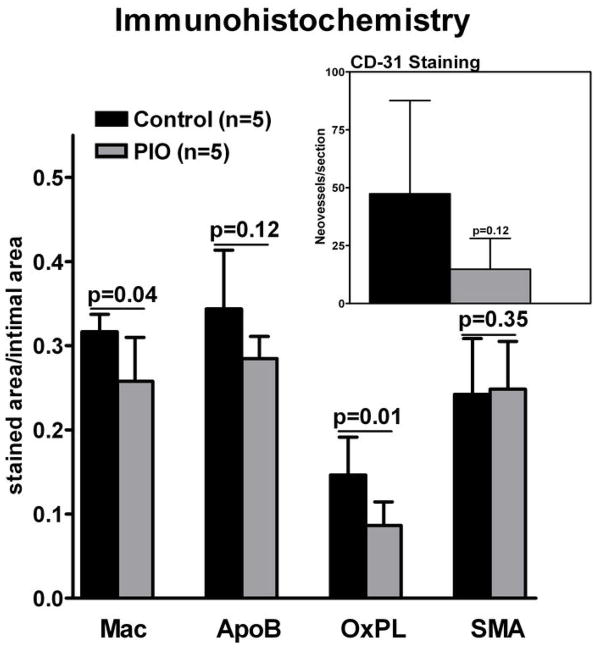
Results: The (18)F-FDG-PET/CT imaging detected an increase in average standardized uptake value in the control group (p < 0.01), indicating progressive inflammation, whereas stable standardized uptake values were observed in the treatment group, indicating no progression. The DCE-MRI analysis detected a significant decrease in the area under the curve for the pioglitazone group (p < 0.01). Immunohistologic examination of the aortas demonstrated a significant decrease in macrophage and oxidized phospholipid immunoreactivity in the pioglitazone group (p = 0.04 and p = 0.01, respectively) with respect to control animals, underlining the imaging results. Serum metabolic parameters showed no difference between groups. Strong positive correlations between standardized uptake value and macrophage density and between area under the curve and neovessels were detected (r(2) = 0.86 and p < 0.0001, and r(2) = 0.66 and p = 0.004, respectively).

Conclusions: Both (18)F-FDG-PET/CT and DCE-MRI demonstrate noninvasively the anti-inflammatory effects of pioglitazone on atheroma. Both imaging methods seem suited to monitor inflammation in atherosclerosis.


Figures

Figure 1
Figure 1. Study Design
Atherosclerosis was induced in 15 New Zealand White Rabbits through a combination of double balloon injury and high cholesterol diet. After 4 months diet first imaging scans and lipid profiles were performed (baseline) and animals were divided into two groups: control group and pioglitazone group. After a total of 5 months another round of imaging scans and lipid profiles (1 month imaging) were performed. The final imaging scans and lipid profiles were performed after a total of 7 months (3 month imaging). All animals were then immediately sacrificed and tissue analysis was performed.
Figure 2
Figure 2. Regression Analysis
2A. Correlation between max¯ standard uptake value ( SUVmax¯) generated from FDG-PET/CT imaging and macrophage density (stained area/intimal area) from histological staining. 2B. Correlation between mean AUC1min generated from DCE-MRI imaging and neovessel count per histological section. 2C . Correlation between mean standard uptake value (SUV) and neovessel count per histological section. 2D. Correlation between mean AUC1min generated from DCE-MRI imaging and macrophage density. 2E. Correlation between mean standard uptake value (SUV) and mean AUC1min. Black line, regression line; dashed line, 95% confidence interval.
Figure 3
Figure 3. FDG-PET/CT
Left hand, Figures 3A–F, coronal PET images through the abdominal aorta (white arrowheads) from one representative animal per group. Figure 3A and 3D, baseline control- and baseline pioglitazone (PIO) group. Figure 3B and 3E, 1-month control and 1-month PIO group. Figure 3C and 3F, 3-month control and PIO group. On the right hand side two bar graphs summarize the changes in SUVmax (top) and SUVmean (bottom) at baseline (BL), one month (1M) and three months (3M) for both groups. Right hand bar shows values for non-atherosclerotic chow fed animals. Values are represented as mean ± standard deviation. *p<0.05 when comparing control and PIO group. Schematic slopes are indicated as dashed lines.
Figure 4
Figure 4. Dynamic-contrast-enhanced MRI
Left hand side, Figures 4A–F show single slice axial T1 weighted MRI images with color encoded overlay of the contrast signal at one minute of the abdominal aorta with insert of the aorta. Figure 4A and 4D, baseline control and baseline pioglitazone (PIO) group. Figure 4B and 4E, 1-month control and PIO group Figure 4C and 4F, 3-month control- and pioglitazone group. Warm colors (orange to red) indicate higher AUC values and cold colors (green to blue) indicate lower AUC values. On the right hand side a bar graph summarizes the changes in the AUC at baseline (BL), one month (1M) and after three month (3M) for the control and PIO group. Values are represented as mean ± standard deviation. *p<0.05 when comparing baseline and 3M in the PIO group. Schematic slopes are indicated as dashed lines; n.s.=non-significant and **p=0.01 when comparing individual slopes against zero.
Figure 5
Figure 5. Multi-contrast-MRI
Figure 5A–F, single slice axial T2 weighted representative MRI images with insert of the aorta with T2-, T1- and Proton Density (PD)-weighing. Figure 5A and 5D , baseline control and pioglitazone (PIO) group. Figure 5B and 5E, 1-month control and PIO group. Figure 5C and 5F: 3-month control and PIO group. Right hand side a bar graph summarizes the changes in the vessel wall area at baseline (BL), one month (1M)- and three month (3M) of either control or PIO group. Values are represented as mean ± standard deviation, n.s.=non-significant
Figure 6
Figure 6. Immunohistology
Representative images of immunohistological staining of the abdominal aorta after 3 months of vehicle- (control; Figure 6A–D) and pioglitazone (PIO) treatment (Figure 6E–H). Staining (red-brown, red arrowheads) for macrophages (Mac; Figure 5A and 5E), apolipoprotein B (ApoB; Figure 6B and 6F), oxidized phospholipids (OxPL; Figure 6C and 6G) and smooth muscle actin (SMA; Figure 6D and 6H) is shown. Objective magnification: 10x. The lumen is on the right hand side from the tissue.
Figure 7
Figure 7. Summary Immunohistology
Macrophages (Mac), apolipoprotein B (ApoB), oxidized phospholipids (OxPL) and smooth muscle actin (SMA) staining at 3 months of vehicle and pioglitazone (PIO) treated animals. Insert shows CD-31 staining for neovessels. Values are represented as means ± standard deviation. Individual p-values between control and PIO group indicated above bar graph.

Comment in

References

    1. Dahlöf B. Cardiovascular disease risk factors: Epidemiology and risk assessment. Amer J Cardiol. 2010;105:3A–9A. - PubMed
    1. Libby P, Ridker PM, Hansson GK. Inflammation in Atherosclerosis: From Pathophysiology to Practice. J Am Col Cardiol. 2009;54:2129–2138. - PMC - PubMed
    1. Ross R. Atherosclerosis -- An Inflammatory Disease. N Engl J Med. 1999;340:115–126. - PubMed
    1. Fuster V, Moreno PR, Fayad ZA, Corti R, Badimon JJ. Atherothrombosis and High-Risk Plaque: Part I: Evolving Concepts. J Am Col Cardiol. 2005;46:937–954. - PubMed
    1. Natarajan P, Ray KK, Cannon CP. High-Density Lipoprotein and coronary heart disease: Current and future therapies. J Am Coll of Cardiol. 2010;55:1283–1299. - PubMed

MeSH terms