. 2011 Oct 14;147(2):344-57.
doi: 10.1016/j.cell.2011.09.029.

Coding-independent regulation of the tumor suppressor PTEN by competing endogenous mRNAs

Affiliations

Coding-independent regulation of the tumor suppressor PTEN by competing endogenous mRNAs

Yvonne Tay et al. Cell. .

Abstract

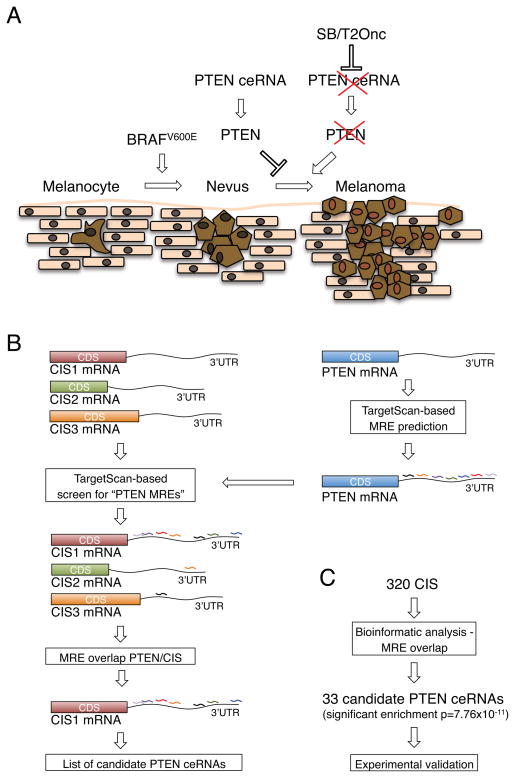
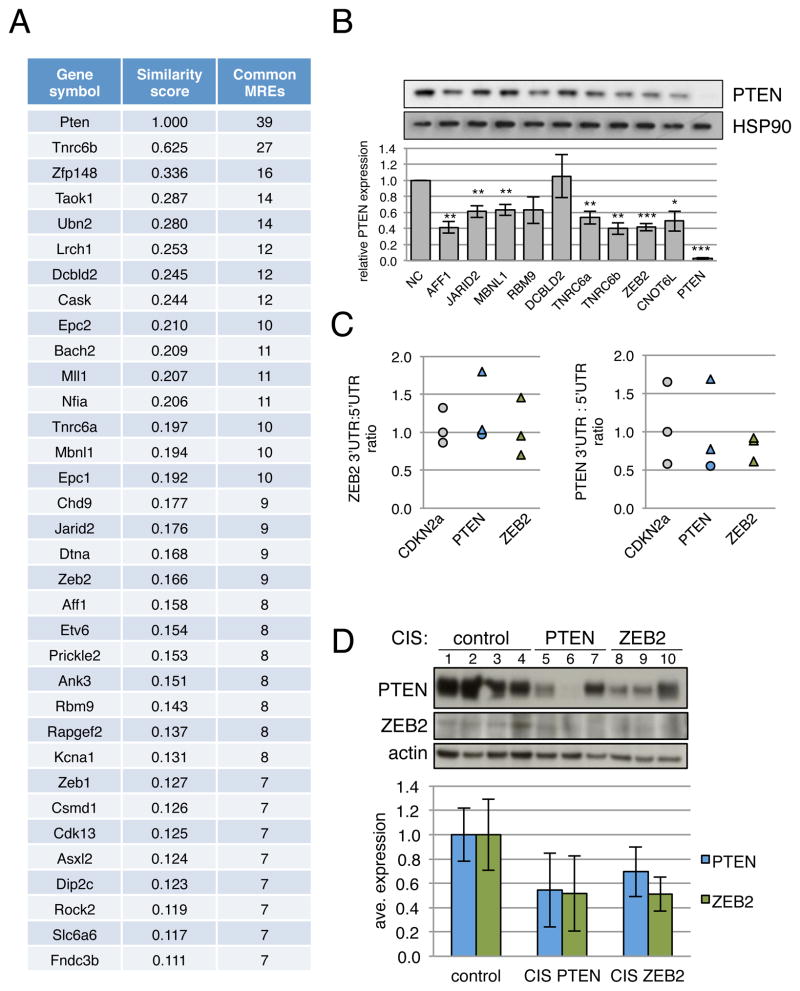
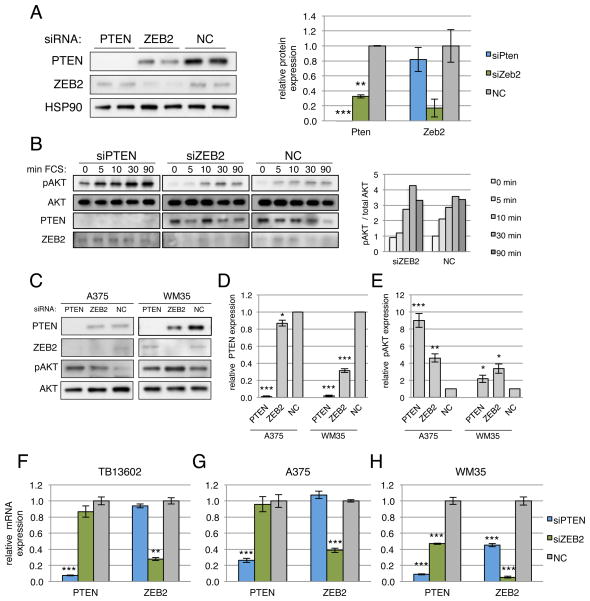
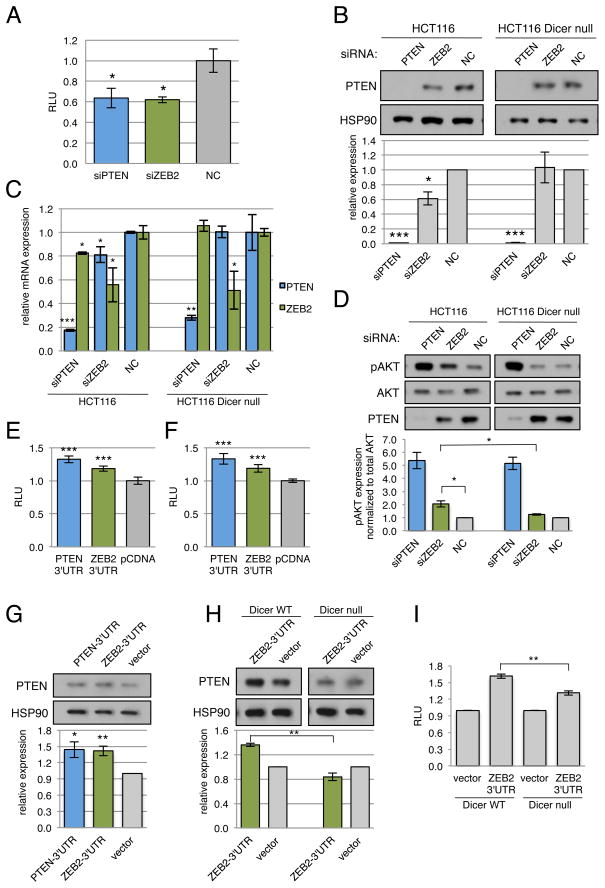
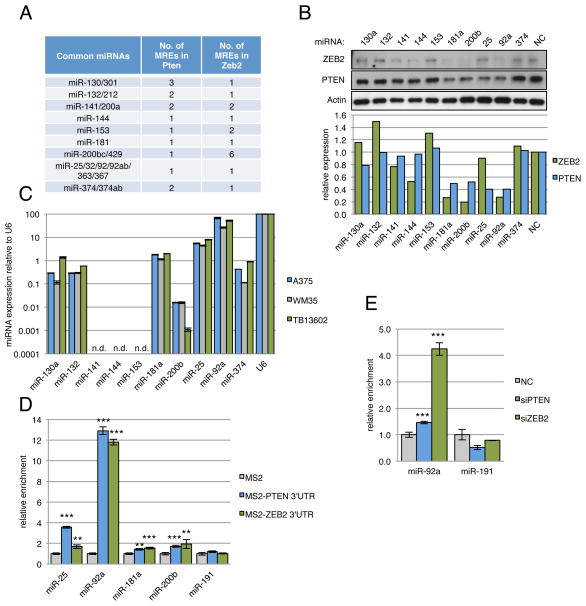
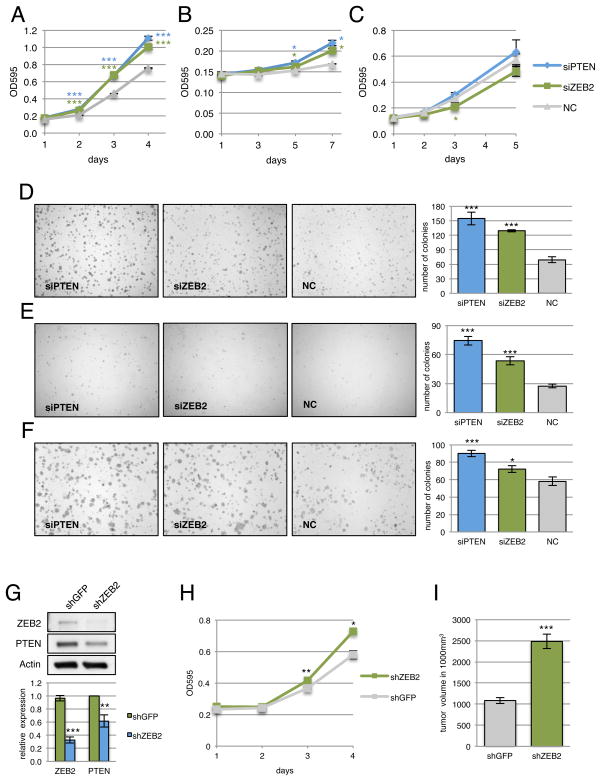
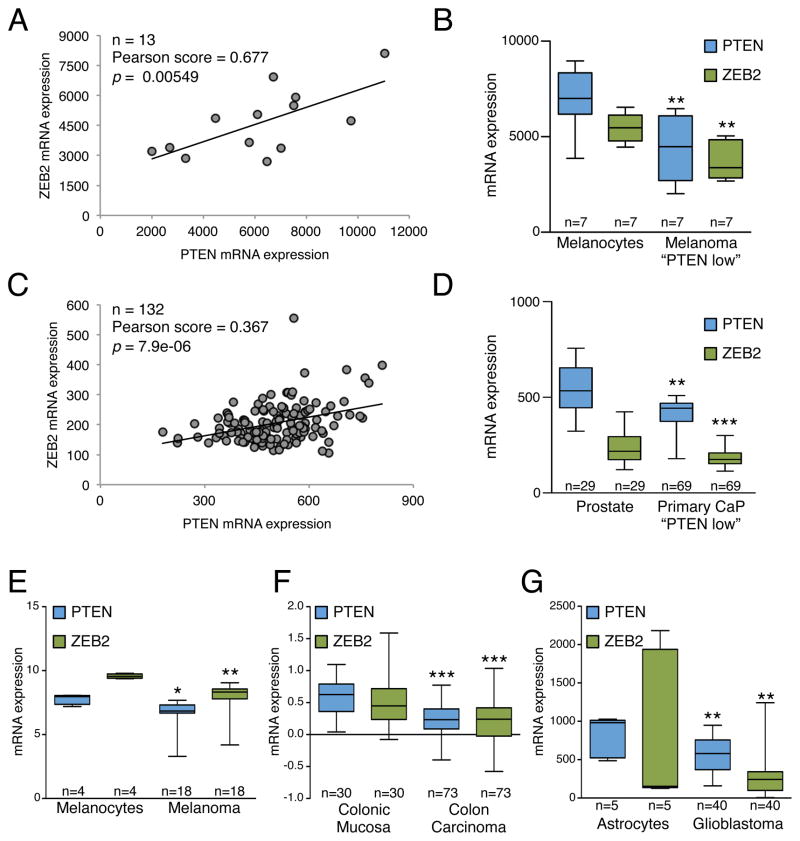
Here, we demonstrate that protein-coding RNA transcripts can crosstalk by competing for common microRNAs, with microRNA response elements as the foundation of this interaction. We have termed such RNA transcripts as competing endogenous RNAs (ceRNAs). We tested this hypothesis in the context of PTEN, a key tumor suppressor whose abundance determines critical outcomes in tumorigenesis. By a combined computational and experimental approach, we identified and validated endogenous protein-coding transcripts that regulate PTEN, antagonize PI3K/AKT signaling, and possess growth- and tumor-suppressive properties. Notably, we also show that these genes display concordant expression patterns with PTEN and copy number loss in cancers. Our study presents a road map for the prediction and validation of ceRNA activity and networks and thus imparts a trans-regulatory function to protein-coding mRNAs.


Figures

Figure 1
Figure 1. (related to Figure S1 and Table S1): Mutually targeted MRE enrichment (MuTaME) analysis predicts competitive endogenous RNAs for PTEN
(A) Schematic outlining the MuTaME analysis and subsequent experimental validation strategy. Validated PTEN-targeting microRNAs were used to predict putative PTEN ceRNAs. Candidates sharing at least 7 microRNAs were considered putative PTEN ceRNAs. (B) MS2-RIP followed by microRNA RT-PCR to detect microRNAs endogenously associated with PTEN 3′UTR. Mean ± s.d., n ≥ 3, *P < 0.05, **P < 0.01. (C) Heat map showing MRE enrichment of the top 20 (upper panel) and bottom 20 (middle panel) putative PTEN ceRNAs and 25 randomly selected transcripts (lower panel). (D) Table summarizing predicted MREs in the 3′UTRs of the top 7 putative PTEN ceRNAs.
Figure 2
Figure 2. (related to Figure S2): Co-expression of PTEN and PTEN ceRNAs in human cancer
(A, B) Comparison of PTEN ceRNA expression levels in primary (A) prostate cancer and (B) glioblastoma between two subsets of samples: “PTEN high” and “PTEN low”, classified according to the average PTEN expression level. P < 0.001 except for SERINC1 in glioblastoma where P = 0.009. The ends of the whiskers represent the minimum and maximum of all the data. (C) Co-expression analysis of PTEN and PTEN ceRNAs in subsets of the human prostate cancer specimens analyzed in (A) with decreased (blue, top panels) or increased (red, bottom panels) expression of PTEN-targeting microRNAs. P < 0.001 for all graphs except for SERINC1 microRNA up (P = 0.002) and ZNF460 microRNA up (P = 0.024). See also Figure S2.
Figure 3
Figure 3. (related to Figure S3): Putative PTEN ceRNAs modulate PTEN expression
(A) Western blot for PTEN protein levels in DU145 cells transfected with siRNA against predicted ceRNAs SERINC1 (siSER), ZNF460 (siZNF), VAPA (siVAPA), and CNOT6L (siCNO) and selected non-targeting controls ACSL4 (siACS) and UNC5CL (siUNC). (B) Quantitation of PTEN protein shown in (A) and PTEN mRNA changes after transfection with siRNA against ceRNA as measured by RT-PCR. (C) Luciferase activity in DU145 cells co-transfected with siRNA against PTEN ceRNAs and a luciferase-PTEN 3′UTR reporter construct. (D) Luciferase activity in DU145 cells co-transfected with PTEN ceRNAs 3′UTRs and a luciferase-PTEN 3′UTR reporter construct. (E) Western blot showing PTEN protein in response to overexpression of ceRNA 3′UTRs in DU145 cells. (F) Quantitation of PTEN protein shown in (E). (G) Western blot for PTEN in HCT116 WT (top panel) and DICER−/− (bottom panel) cells transfected with siRNAs against PTEN ceRNAs. (H) Quantitation of PTEN protein shown in (G). (B,D–F,H) Mean ± s.d., n ≥ 4, *P < 0.05; **P < 0.01; ***P < 0.001.
Figure 4
Figure 4. (related to Figure S4): MicroRNA-dependency of PTEN ceRNA function
(A) Schematic outlining the predicted binding sites of PTEN-targeting microRNAs to the 3′UTR of VAPA. The 2 fragments VAPA 3′U1 and VAPA 3′U2 were used for the luciferase experiments. (B) Luciferase activity in DU145 cells co-transfected with validated PTEN-targeting microRNAs predicted to target VAPA and luciferase-VAPA-3′UTR1 and 3′UTR2 reporter constructs. (C) Western blot analysis of PTEN and VAPA expression in DU145 cells transfected with validated PTEN-targeting microRNAs predicted to target VAPA. (D) Schematic outlining the predicted binding sites of PTEN-targeting microRNAs to the 3′UTR of CNOT6L. The 2 fragments CNO 3′U1 and CNO 3′U2 were used for the luciferase and RIP experiments. (E) Luciferase activity in DU145 cells co-transfected with validated PTEN-targeting microRNAs predicted to target CNOT6L and luciferase-CNOT-3′UTR1 and 3′UTR2 reporter constructs. (F) RIP followed by microRNA RT-PCR shows enrichment of PTEN-targeting microRNAs associated with CNOT6L 3′UTR. (B–C,E–F) Mean ± s.d., n ≥ 4, *P < 0.05; **P < 0.01; ***P < 0.001.
Figure 5
Figure 5. Depletion of PTEN ceRNAs activates the PI3K/AKT pathway and promotes growth in vitro
(A) Western blot for phospho-AKT following serum starvation and re-stimulation of PTEN ceRNA siRNA-transfected DU145 cells (top panels), HCT116 WT (middle panels) and DICER−/− cells (lower panels). Quantitation of Western analyses is shown below the respective blots. (B) Proliferation curve of DU145 cells (top panels), HCT116 WT (middle panels) and DICER−/− cells (lower panels) transfected with siRNAs against PTEN ceRNAs. siPTEN, siCNOT6L and siVAPA result in a significant increase in growth relative to the siNC control in DU145 and HCT WT cells (P < 0.001 in DU145, P < 0.01 in HCT WT). In the HCT D−/− cells, siCNOT6L (P < 0.05) and siVAPA (P < 0.01) result in a significant decrease in growth relative to the siPTEN positive control. (C) Proliferation curve of DU145 cells transfected with plasmids overexpressing PTEN or ceRNA 3′UTRs. Relative to the empty vector control (pcDNA) transfection, CNOT 3′UTR2 (P < 0.05), VAPA 3′UTR1 (P < 0.05), VAPA 3′UTR2 (P < 0.001) and PTEN 3′UTR (P < 0.001) result in a significant decrease in growth. (B,C) Mean ± s.d., n ≥ 3.
Figure 6
Figure 6. VAPA and CNOT6L possess tumor suppressive properties
(A) Anchorage-independent growth of DU145 cells transfected with siRNAs against PTEN ceRNAs in semi-solid medium. Lower panel shows quantitation of colony formation after 10 days. Mean ± s.e., n ≥ 3, ***P < 0.001. (B) Heatmap depicting the genomic status of PTEN, VAPA and CNOT6L in human colon adenocarcinoma compared to normal samples. Scale: log2 copy number units, P = 1.74e−4, 1.37e−7, 3.19e−6 for PTEN, VAPA and CNOT6L respectively. (C) Model of regulation of PTEN expression. Post-transcriptional regulation via sequestration of microRNAs by ceRNAs represents a trans-regulatory dimension of PTEN regulation.
Figure 7
Figure 7

Comment in

  • Epigenetics. Layer by layer.
    McCarthy N. McCarthy N. Nat Rev Cancer. 2011 Nov 3;11(12):830. doi: 10.1038/nrc3172. Nat Rev Cancer. 2011. PMID: 22048565 No abstract available.
  • Regulatory RNA: layer by layer.
    McCarthy N. McCarthy N. Nat Rev Genet. 2011 Nov 3;12(12):804. doi: 10.1038/nrg3108. Nat Rev Genet. 2011. PMID: 22048663 No abstract available.
  • RNA: a new layer of regulation.
    David R. David R. Nat Rev Mol Cell Biol. 2011 Nov 3;12(12):766. doi: 10.1038/nrm3225. Nat Rev Mol Cell Biol. 2011. PMID: 22048709 No abstract available.
  • ceRNAs: miRNA target mimic mimics.
    Rubio-Somoza I, Weigel D, Franco-Zorilla JM, García JA, Paz-Ares J. Rubio-Somoza I, et al. Cell. 2011 Dec 23;147(7):1431-2. doi: 10.1016/j.cell.2011.12.003. Cell. 2011. PMID: 22196719 No abstract available.

References

    1. Alimonti A, Carracedo A, Clohessy JG, Trotman LC, Nardella C, Egia A, Salmena L, Sampieri K, Haveman WJ, Brogi E, et al. Subtle variations in Pten dose determine cancer susceptibility. Nat Gen. 2010;42:454–458. - PMC - PubMed
    1. Altschul SF, Gish W, Miller W, Myers EW, Lipman DJ. Basic local alignment search tool. J Mol Biol. 1990;215:403–410. - PubMed
    1. Arvey A, Larsson E, Sander C, Leslie CS, Marks DS. Target mRNA abundance dilutes microRNA and siRNA activity. Mol Syst Biol. 2010;6:363. - PMC - PubMed
    1. Bartel DP. MicroRNAs: target recognition and regulatory functions. Cell. 2009;136:215–233. - PMC - PubMed
    1. Bartel DP, Chen CZ. Micromanagers of gene expression: the potentially widespread influence of metazoan microRNAs. Nat Rev Genet. 2004;5:396–400. - PubMed

Publication types