

A new generation of crystallographic validation tools for the protein data bank
- PMID: 22000512
- PMCID: PMC3195755
- DOI: 10.1016/j.str.2011.08.006
A new generation of crystallographic validation tools for the protein data bank
Abstract
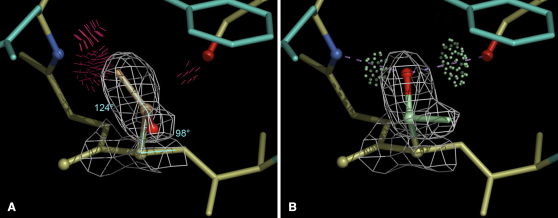
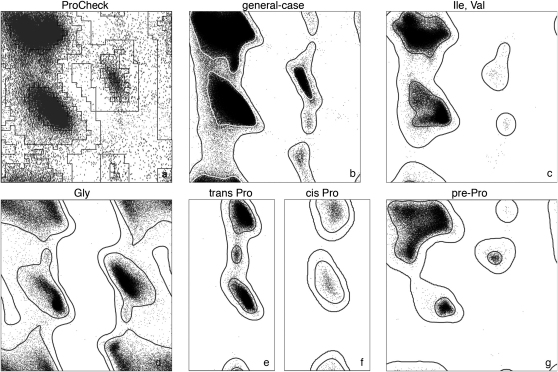
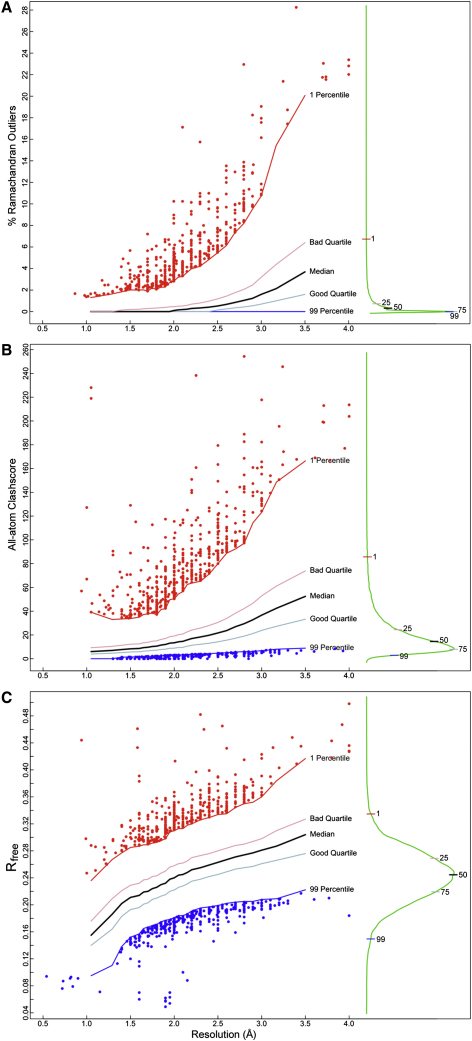
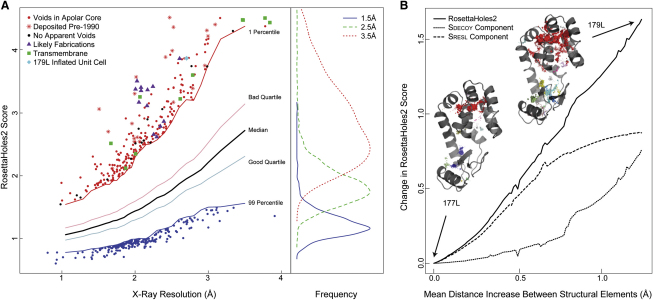
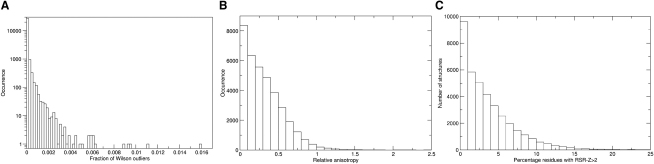
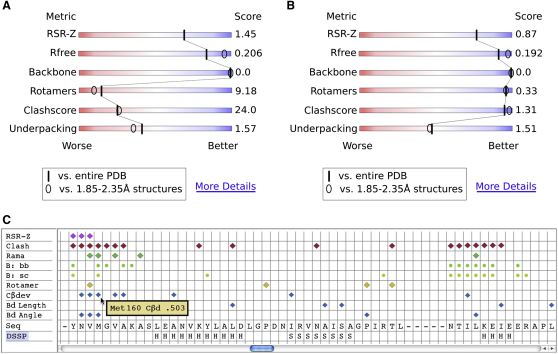
This report presents the conclusions of the X-ray Validation Task Force of the worldwide Protein Data Bank (PDB). The PDB has expanded massively since current criteria for validation of deposited structures were adopted, allowing a much more sophisticated understanding of all the components of macromolecular crystals. The size of the PDB creates new opportunities to validate structures by comparison with the existing database, and the now-mandatory deposition of structure factors creates new opportunities to validate the underlying diffraction data. These developments highlighted the need for a new assessment of validation criteria. The Task Force recommends that a small set of validation data be presented in an easily understood format, relative to both the full PDB and the applicable resolution class, with greater detail available to interested users. Most importantly, we recommend that referees and editors judging the quality of structural experiments have access to a concise summary of well-established quality indicators.
Copyright © 2011 Elsevier Ltd. All rights reserved.
Figures
Similar articles
-
Automated and accurate deposition of structures solved by X-ray diffraction to the Protein Data Bank.Acta Crystallogr D Biol Crystallogr. 2004 Oct;60(Pt 10):1833-9. doi: 10.1107/S0907444904019419. Epub 2004 Sep 23. Acta Crystallogr D Biol Crystallogr. 2004. PMID: 15388930
-
Worldwide Protein Data Bank validation information: usage and trends.Acta Crystallogr D Struct Biol. 2018 Mar 1;74(Pt 3):237-244. doi: 10.1107/S2059798318003303. Epub 2018 Mar 2. Acta Crystallogr D Struct Biol. 2018. PMID: 29533231 Free PMC article.
-
Announcing mandatory submission of PDBx/mmCIF format files for crystallographic depositions to the Protein Data Bank (PDB).Acta Crystallogr D Struct Biol. 2019 Apr 1;75(Pt 4):451-454. doi: 10.1107/S2059798319004522. Epub 2019 Apr 8. Acta Crystallogr D Struct Biol. 2019. PMID: 30988261 Free PMC article.
-
Stereochemistry and Validation of Macromolecular Structures.Methods Mol Biol. 2017;1607:595-610. doi: 10.1007/978-1-4939-7000-1_24. Methods Mol Biol. 2017. PMID: 28573590 Free PMC article. Review.
-
The Protein Data Bank Archive.Methods Mol Biol. 2021;2305:3-21. doi: 10.1007/978-1-0716-1406-8_1. Methods Mol Biol. 2021. PMID: 33950382 Review.
Cited by
-
Smooth statistical torsion angle potential derived from a large conformational database via adaptive kernel density estimation improves the quality of NMR protein structures.Protein Sci. 2012 Dec;21(12):1824-36. doi: 10.1002/pro.2163. Epub 2012 Oct 18. Protein Sci. 2012. PMID: 23011872 Free PMC article.
-
The Cac1 subunit of histone chaperone CAF-1 organizes CAF-1-H3/H4 architecture and tetramerizes histones.Elife. 2016 Sep 30;5:e18023. doi: 10.7554/eLife.18023. Elife. 2016. PMID: 27690308 Free PMC article.
-
An approach to creating a more realistic working model from a protein data bank entry.J Mol Model. 2015 Jan;21(1):3. doi: 10.1007/s00894-014-2520-1. Epub 2015 Jan 22. J Mol Model. 2015. PMID: 25605595 Free PMC article.
-
Iris: Interactive all-in-one graphical validation of 3D protein model iterations.Protein Sci. 2021 Jan;30(1):93-107. doi: 10.1002/pro.3955. Epub 2020 Oct 19. Protein Sci. 2021. PMID: 32964594 Free PMC article.
-
New tools for the analysis and validation of cryo-EM maps and atomic models.Acta Crystallogr D Struct Biol. 2018 Sep 1;74(Pt 9):814-840. doi: 10.1107/S2059798318009324. Epub 2018 Sep 3. Acta Crystallogr D Struct Biol. 2018. PMID: 30198894 Free PMC article.
References
-
- Afonine P.V., Grosse-Kunstleve R.W., Adams P.D. The Phenix refinement framework. CCP4 Newsletter. 2005;42 contribution 8.
-
- Afonine P.V., Grosse-Kunstleve R.W., Chen V.B., Headd J.J., Moriarty N.W., Richardson J.S., Richardson D.C., Urzhumtsev A., Zwart P.H., Adams P.D. phenix.model_vs_data: a high-level tool for the calculation of crystallographic model and data statistics. J. Appl. Cryst. 2010;43:669–676. - PMC - PubMed
-
- Allen F.H. The Cambridge Structural Database: a quarter of a million crystal structures and rising. Acta Crystallogr. B. 2002;58:380–388. - PubMed
-
- Arendall W.B., 3rd, Tempel W., Richardson J.S., Zhou W., Wang S., Davis I.W., Liu Z.-J., Rose J.P., Carson W.M., Luo M. A test of enhancing model accuracy in high-throughput crystallography. J. Struct. Funct. Genomics. 2005;6:1–11. - PubMed
Publication types
MeSH terms
Substances
Grants and funding
- 1P01 GM063210/GM/NIGMS NIH HHS/United States
- 082961/WT_/Wellcome Trust/United Kingdom
- R01 GM073930/GM/NIGMS NIH HHS/United States
- HHMI/Howard Hughes Medical Institute/United States
- R01-GM073930/GM/NIGMS NIH HHS/United States
- R01 GM081544/GM/NIGMS NIH HHS/United States
- P01 GM063210/GM/NIGMS NIH HHS/United States
- WT_/Wellcome Trust/United Kingdom
- R01 GM073919/GM/NIGMS NIH HHS/United States
- R01-DK42303/DK/NIDDK NIH HHS/United States
- R01-GM81544/GM/NIGMS NIH HHS/United States
- R01 GM053163/GM/NIGMS NIH HHS/United States
- R01 DK042303/DK/NIDDK NIH HHS/United States
- BB/F020805/1/BB_/Biotechnology and Biological Sciences Research Council/United Kingdom
- R01-GM073919/GM/NIGMS NIH HHS/United States
LinkOut - more resources
Full Text Sources
Other Literature Sources
