Constant electric field simulations of the membrane potential illustrated with simple systems
- PMID: 22001851
- PMCID: PMC3575077
- DOI: 10.1016/j.bbamem.2011.09.030
Constant electric field simulations of the membrane potential illustrated with simple systems
Abstract
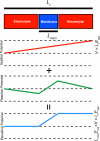
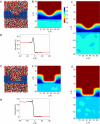
Advances in modern computational methods and technology make it possible to carry out extensive molecular dynamics simulations of complex membrane proteins based on detailed atomic models. The ultimate goal of such detailed simulations is to produce trajectories in which the behavior of the system is as realistic as possible. A critical aspect that requires consideration in the case of biological membrane systems is the existence of a net electric potential difference across the membrane. For meaningful computations, it is important to have well validated methodologies for incorporating the latter in molecular dynamics simulations. A widely used treatment of the membrane potential in molecular dynamics consists of applying an external uniform electric field E perpendicular to the membrane. The field acts on all charged particles throughout the simulated system, and the resulting applied membrane potential V is equal to the applied electric field times the length of the periodic cell in the direction perpendicular to the membrane. A series of test simulations based on simple membrane-slab models are carried out to clarify the consequences of the applied field. These illustrative tests demonstrate that the constant-field method is a simple and valid approach for accounting for the membrane potential in molecular dynamics studies of biomolecular systems. This article is part of a Special Issue entitled: Membrane protein structure and function.
Copyright © 2011 Elsevier B.V. All rights reserved.
Figures


Similar articles
-
Transmembrane Potential Modeling: Comparison between Methods of Constant Electric Field and Ion Imbalance.J Chem Theory Comput. 2016 May 10;12(5):2418-25. doi: 10.1021/acs.jctc.5b01202. Epub 2016 Apr 5. J Chem Theory Comput. 2016. PMID: 27014925
-
Response of a single cell to an external electric field.Biophys J. 1994 Jun;66(6):1768-76. doi: 10.1016/S0006-3495(94)80971-3. Biophys J. 1994. PMID: 8075318 Free PMC article.
-
Molecular Dynamics Simulations Are Redefining Our View of Peptides Interacting with Biological Membranes.Acc Chem Res. 2018 May 15;51(5):1106-1116. doi: 10.1021/acs.accounts.7b00613. Epub 2018 Apr 18. Acc Chem Res. 2018. PMID: 29667836
-
Living on the edge: Simulations of bacterial outer-membrane proteins.Biochim Biophys Acta. 2016 Jul;1858(7 Pt B):1753-9. doi: 10.1016/j.bbamem.2016.01.020. Epub 2016 Jan 28. Biochim Biophys Acta. 2016. PMID: 26826270 Review.
-
Voltage-morphology coupling in biomimetic membranes: dynamics of giant vesicles in applied electric fields.Soft Matter. 2015 Oct 7;11(37):7232-6. doi: 10.1039/c5sm01050k. Epub 2015 Aug 28. Soft Matter. 2015. PMID: 26314545 Review.
Cited by
-
Simulations on Simple Models of Connexin Hemichannels Indicate That Ca2+ Blocking Is Not a Pure Electrostatic Effect.Membranes (Basel). 2021 May 20;11(5):372. doi: 10.3390/membranes11050372. Membranes (Basel). 2021. PMID: 34065259 Free PMC article.
-
Exploring the pore charge dependence of K+ and Cl- permeation across a graphene monolayer: a molecular dynamics study.RSC Adv. 2019 Jul 1;9(35):20402-20414. doi: 10.1039/c9ra03025e. eCollection 2019 Jun 25. RSC Adv. 2019. PMID: 35514713 Free PMC article.
-
Dissecting current rectification through asymmetric nanopores.Biophys J. 2025 Feb 18;124(4):597-603. doi: 10.1016/j.bpj.2024.11.3318. Epub 2024 Nov 29. Biophys J. 2025. PMID: 39614613
-
Complexes of vertebrate TMC1/2 and CIB2/3 proteins form hair-cell mechanotransduction cation channels.bioRxiv [Preprint]. 2024 Jul 5:2023.05.26.542533. doi: 10.1101/2023.05.26.542533. bioRxiv. 2024. Update in: Elife. 2025 Jan 08;12:RP89719. doi: 10.7554/eLife.89719. PMID: 37398045 Free PMC article. Updated. Preprint.
-
Atomistic mechanism of non-selective cation permeation in cyclic nucleotide-gated CNGA1 ion channel by molecular dynamics simulations.Commun Biol. 2025 Aug 23;8(1):1272. doi: 10.1038/s42003-025-08705-5. Commun Biol. 2025. PMID: 40849533 Free PMC article.
References
-
- Hille B. Ion channels of excitable membranes. 3rd Edition Sinauer Associates; Sunderland, MA: 2001.
-
- Roux B, Bernèche S, Im W. Ion channels, permeation and electrostatics: Insight into the function of KcsA. Biochemistry. 2000;39:13295–13306. - PubMed
-
- Jogini V, Roux B. Electrostatics of the intracellular vestibule of K+ channels. J. Mol. Biol. 2005;354:272–288. - PubMed
Publication types
MeSH terms
Grants and funding
LinkOut - more resources
Full Text Sources

