

Serum cartilage oligomeric matrix protein (sCOMP) is elevated in patients with knee osteoarthritis: a systematic review and meta-analysis
- PMID: 22001901
- PMCID: PMC3962955
- DOI: 10.1016/j.joca.2011.09.005
Serum cartilage oligomeric matrix protein (sCOMP) is elevated in patients with knee osteoarthritis: a systematic review and meta-analysis
Abstract
Objective: To be used in diagnostic studies, it must be demonstrated that biomarkers can differentiate between diseased and non-diseased patients. Therefore, the purpose of this study was to answer the following questions: (1) Is serum cartilage oligomeric matrix protein (sCOMP) elevated in patients with radiographically diagnosed knee osteoarthritis (OA) compared to controls? (2) Are there differences in sCOMP levels when comparing differing radiographic OA severities to controls?
Methods: Systematic review and meta-analysis.
Data sources: A systematic search of CINAHL, PEDro, Medline, and SportsDiscus was completed in March 2010.
Keywords: knee, osteoarthritis, sCOMP, radiography. Study inclusion criteria: Studies were written in English, compared healthy adults with knee OA patients, used the Kellgren Lawrence (K/L) classification, measured sCOMP, and reported means and standard deviations for sCOMP.
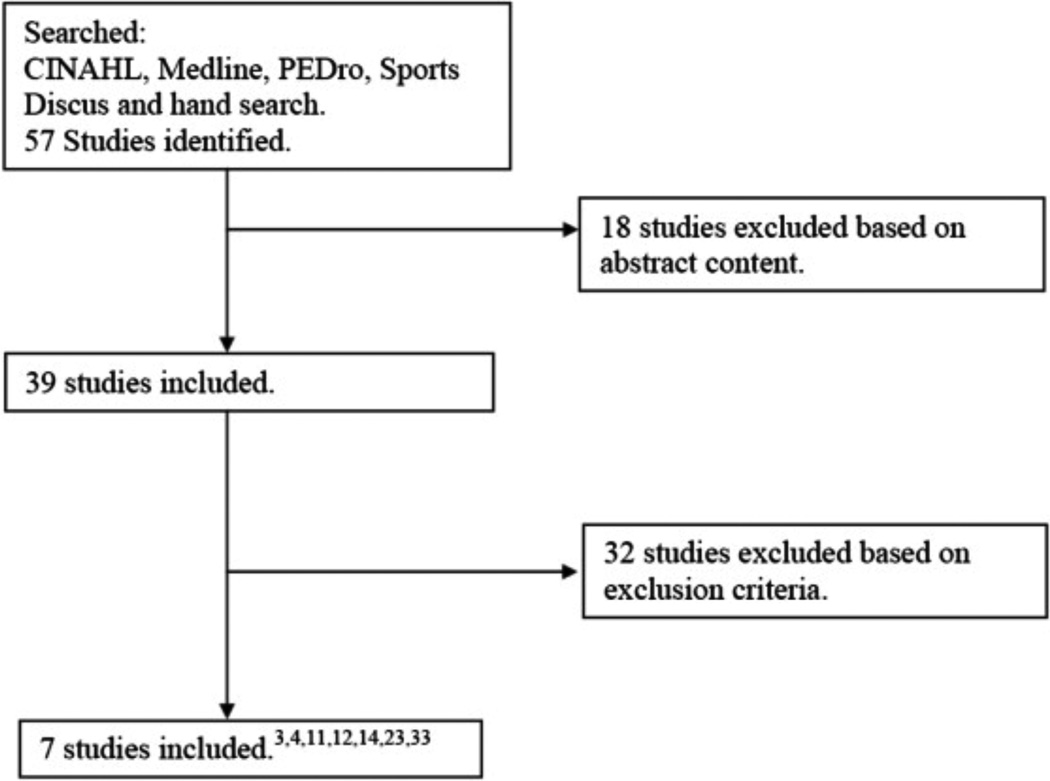
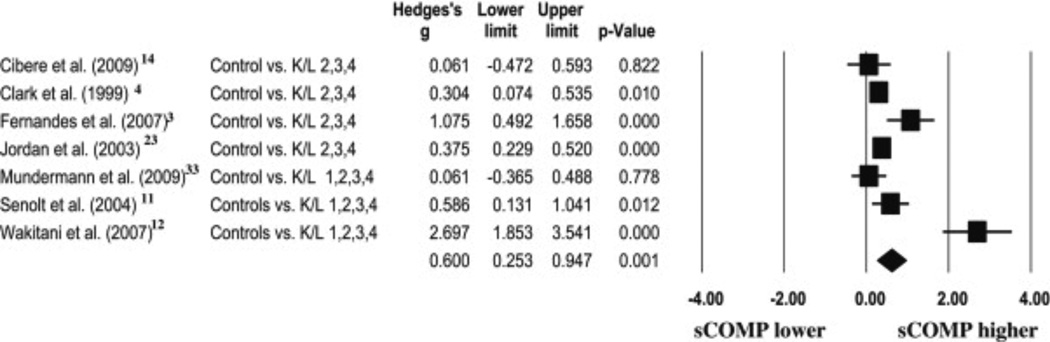
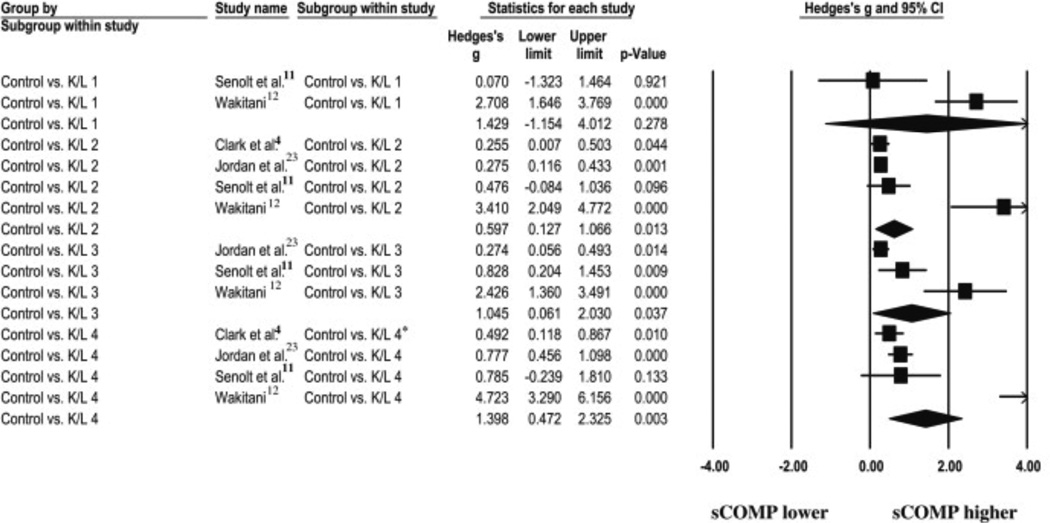
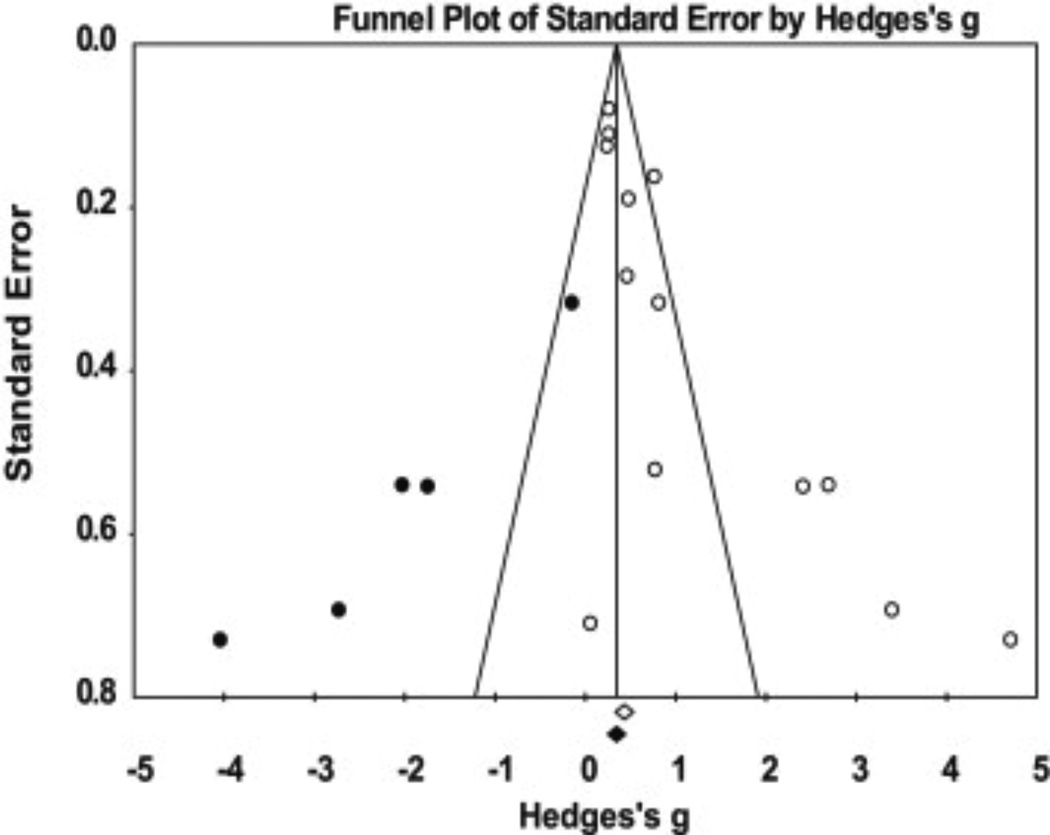
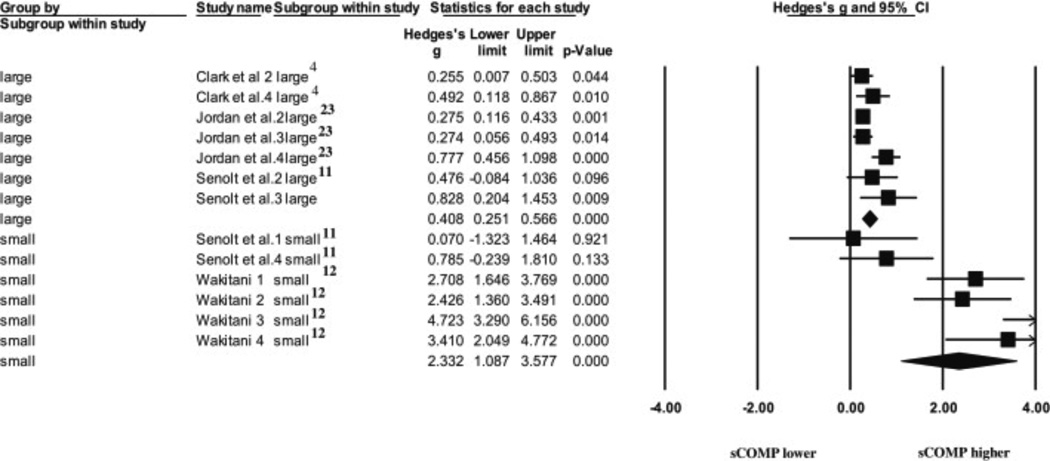
Results: For question 1, seven studies were included resulting in seven comparisons. A moderate overall effect size (ES) indicated sCOMP was consistently elevated in those with radiographically diagnosed knee OA when compared to controls (ES = 0.60, P < 0.001). For question 2, four studies were included resulting in 13 comparisons between radiographic OA severity levels and controls. Strong ESs were calculated for K/L-1 (ES = 1.43, P = 0.28), K/L-3 (ES = 1.05, P = 0.04), and K/L-4 (ES = 1.40, P = 0.003). A moderate ES was calculated for K/L-2 (ES = 0.60, P = 0.01).
Conclusions: These results indicate sCOMP is elevated in patients with knee OA and is sensitive to OA disease progression. Future research studies with a higher level of evidence should be conducted to investigate the use of this biomarker as an indicator for OA development and progression.
Copyright © 2011 Osteoarthritis Research Society International. Published by Elsevier Ltd. All rights reserved.
Conflict of interest statement
There are no competing interests to disclose for any of the authors on this manuscript.
Figures
References
-
- Garnero P, Delmas PD. Biomarkers in osteoarthritis. Curr Opin Rheumatol. 2003;15:641–646. - PubMed
-
- Fernandes FA, Pucinelli MLC, da Silva NP, Feldman D. Serum cartilage oligomeric matrix protein (COMP) levels in knee osteoarthritis in a Brazilian population: clinical and radiological correlation. Scand J Rheumatol. 2007;36(3):211–215. - PubMed
-
- Clark G, Jordan JM, Vilim V, Renner JB, Dragomir AD, Luta G, et al. Serum cartilage oligomeric matrix protein reflects osteoarthritis presence and severity: the Johnston County Osteoarthritis Project. Arthritis Rheum. 1999;42(11):2356–2364. - PubMed
-
- Palmieri-Smith RM, Thomas AC. A neuromuscular mechanism of posttraumatic osteoarthritis associated with ACL injury. Exerc Sport Sci Rev. 2009;37(3):147–153. - PubMed
Publication types
MeSH terms
Substances
Grants and funding
LinkOut - more resources
Full Text Sources
Medical
