. 2012 Jun 7;31(23):2809-23.
doi: 10.1038/onc.2011.468. Epub 2011 Oct 17.

The RAD9-RAD1-HUS1 (9.1.1) complex interacts with WRN and is crucial to regulate its response to replication fork stalling

Affiliations

The RAD9-RAD1-HUS1 (9.1.1) complex interacts with WRN and is crucial to regulate its response to replication fork stalling

P Pichierri et al. Oncogene. .

Abstract

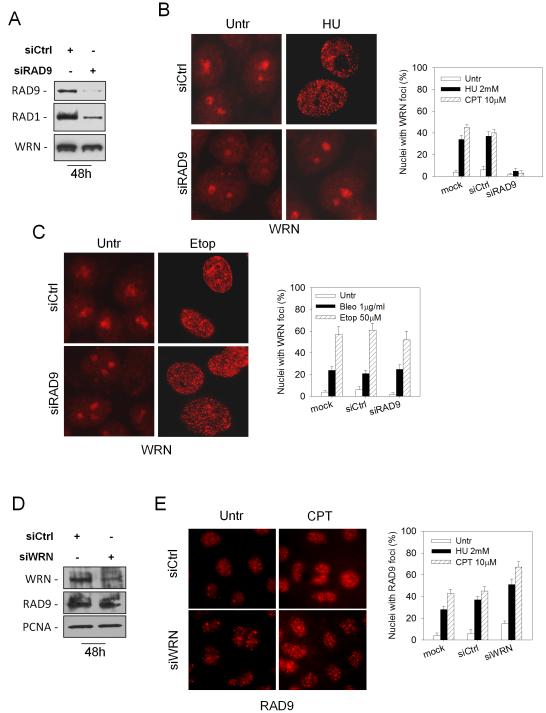
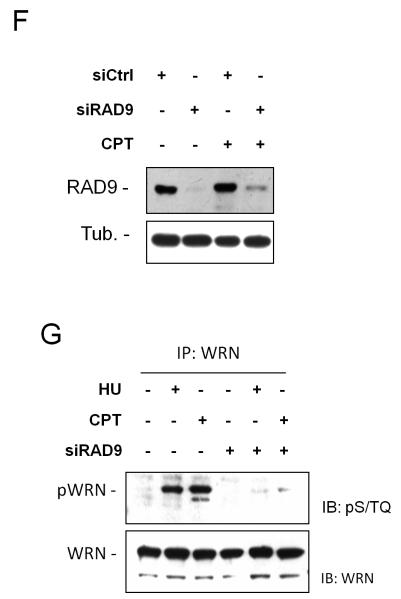
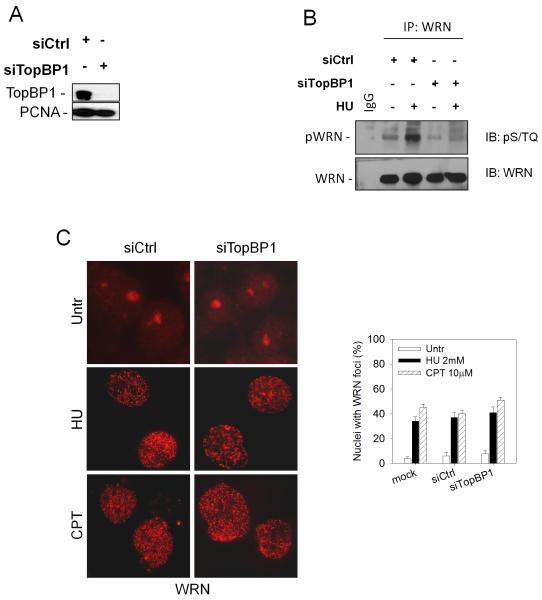
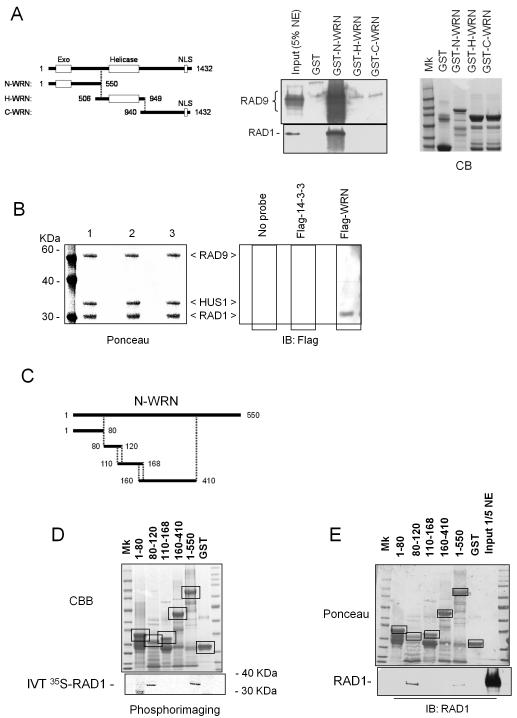
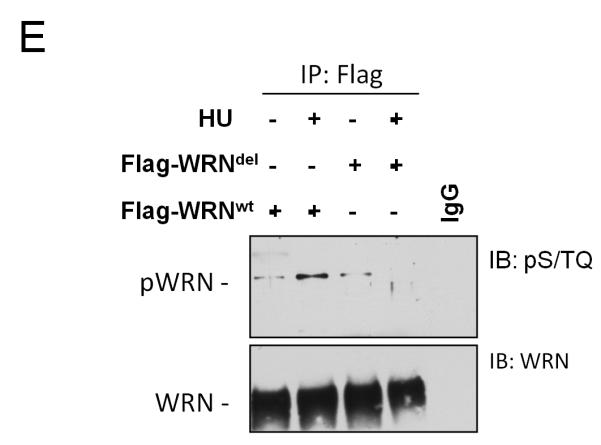
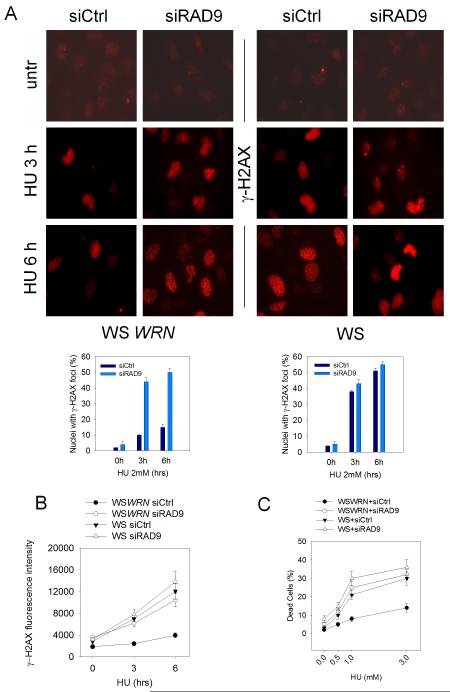
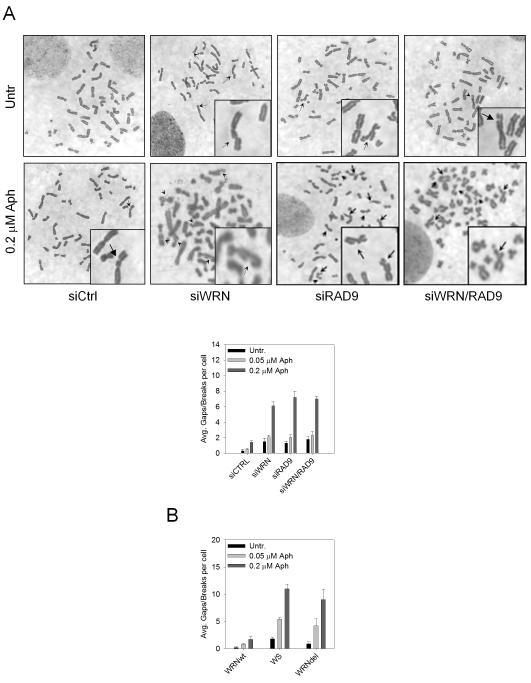
The WRN protein belongs to the RecQ family of DNA helicases and is implicated in replication fork restart, but how its function is regulated remains unknown. We show that WRN interacts with the 9.1.1 complex, one of the central factors of the replication checkpoint. This interaction is mediated by the binding of the RAD1 subunit to the N-terminal region of WRN and is instrumental for WRN relocalization in nuclear foci and its phosphorylation in response to replication arrest. We also find that ATR-dependent WRN phosphorylation depends on TopBP1, which is recruited by the 9.1.1 complex in response to replication arrest. Finally, we provide evidence for a cooperation between WRN and 9.1.1 complex in preventing accumulation of DNA breakage and maintaining genome integrity at naturally occurring replication fork stalling sites. Taken together, our data unveil a novel functional interplay between WRN helicase and the replication checkpoint, contributing to shed light into the molecular mechanism underlying the response to replication fork arrest.


Figures

Figure 1
Figure 1. Abrogation of RAD9 function impairs WRN subnuclear relocalisation and phosphorylation after HU-treatment
(A) Depletion of RAD9 by RNAi. HeLa cells were transfected with siRNAs directed against GFP (siCtrl) or RAD9 (siRAD9) and cell lysates were prepared at the indicated time prior to immunoblotting with anti-RAD9 and anti-RAD1 antibodies. Anti-WRN antibody was used as loading control. (B) WRN relocalisation in HeLa cells transfected with Ctrl or RAD9 siRNAs and 48h later exposed for 6h to HU or CPT prior to immunofluorescence with anti-WRN antibody. In the panel, representative images from the untreated and the HU-treated cells are shown. Graph shows quantification of the nuclei presenting WRN focal staining under different experimental conditions. (C) WRN relocalisation in HeLa cells transfected with Ctrl or RAD9 siRNAs and 48h later exposed for 3h to etoposide (Etop) or bleomycin (Bleo) prior to immunofluorescence with anti-WRN antibody. In the panel, representative images from the untreated and the etoposide-treated cells are shown. Quantification of the nuclei presenting WRN focal staining after etoposide or bleomycin exposure is shown in the graph. (D) Depletion of WRN by RNAi. HeLa cells were transfected with siRNAs directed against GFP (siCtrl) or WRN and cell lysates prepared at the indicated time prior to immunoblotting with anti-WRN antibody. Anti-RAD9 antibody was used to verify that siWRN did not produce disruption of the 9.1.1 complex. Anti-PCNA antibody was used as loading control. (E) RAD9 relocalisation in nuclear foci in cells depleted of WRN. HeLa cells were transfected with Ctrl or WRN siRNAs and 48h thereafter treated for 6h with HU or CPT prior to immunofluorescence with anti-RAD9 antibody. In the panel, representative images from untreated and CPT-treated cells are shown. The percentage of nuclei showing RAD9 focal staining for each experimental condition is reported in the graph. (F) HeLa cells were transfected with siRNAs directed against GFP (siCtrl) or RAD9 (siRAD9) and treated with 10μM CPT for 6h, then cell lysates were prepared to immunoblotting with anti-RAD9 antibody. Anti-tubulin (Tub.) antibody was used as loading control. (G) WRN phosphorylation in RAD9-depleted cells. Mock and RAD9 RNAi-transfected HeLa cells were treated with 2mM HU or 10μM CPT for 6h, then cell extracts were immunoprecipitated (IP) using anti-WRN antibody. WRN phosphorylation was evaluated for the presence of a phospho-reactive band (IB) using anti-pST/Q antibodies. The total amount of WRN immunoprecipitated was determined by anti-WRN antibody (IB). Data are presented as means of three independent experiments. Error bars represent standard error.
Figure 2
Figure 2. Analysis of the requirement of TopBP1 for WRN relocalisation and phosphorylation upon perturbed replication
(A) Depletion of TopBP1 by RNAi. HeLa cells were transfected with siRNAs directed against GFP (siCtrl) or TopBP1 (siTopBP1) and cell lysates immunoblotting with anti-TopBP1 antibody. Anti-PCNA antibody was used as loading control. (B) Analysis of WRN phosphorylation at S/TQ sites in TopBP1-depleted cells after HU treatment. Ctrl and TopBP1 RNAi-transfected HeLa cells were treated with 2mM HU for 8h prior to lysis and immunoprecipitation using an anti-WRN antibody. WRN phosphorylation was evaluated by immunoblotting in the WRN immunoprecipitates with an anti-pST/Q antibody (IB: pS/TQ). The total amount of the immunoprecipitated WRN protein was determined by anti-WRN immunobloting (IB: WRN). Immunoprecipitation using normal rabbit IgG (IgG) was used as a negative control. (C) WRN relocalisation in nuclear foci in cells with abrogated TopBP1 function. HeLa cells were transfected with TopBP1 siRNAs and 48h later were exposed for 6h to HU or CPT prior to immunofluorescence with anti-WRN antibody. In the panel, representative images from the untreated and the HU- or CPT-treated cells are shown. Graph shows quantification of the nuclei presenting WRN focal staining after HU or CPT treatment. Data are presented as means of three independent experiments. Error bars represent standard error.
Figure 3
Figure 3. The 9.1.1 complex and WRN co-immunoprecipitate and co-localise upon replication arrest
(A) WRN immunoprecipitates the 9.1.1 complex. HeLa cells were treated with 2mM HU or 20μM CPT for 6h, then cell lysates were immunoprecipitated (IP) using anti-WRN antibody and normal IgG as a negative control. The presence of RAD9 and RAD1 was assessed by immunoblotting (IB) using the indicated antibodies. Inputs contained 20% of the total lysates used for immunoprecipitation. (B) RAD9 immunoprecipitates WRN. HeLa cells were treated with 2mM HU or 20μM CPT for 6h. Cell extracts were immunoprecipitated (IP) with anti-RAD9 antibody and normal IgG as a negative control. The presence of WRN was evaluated by immunoblotting (IB) using the indicated antibody. (C) Analysis of WRN and RAD9 co-localisation after replication arrest. HeLa cells were treated with 2mM HU for 8h and subjected to immunofluorescence using mouse anti-WRN and rabbit anti-RAD9 antibodies. Representative images from HeLa cells untreated or treated with HU for 8h are presented. Insets show an enlarged portion of the nuclei for a better evaluation of the co-localisation status of WRN with RAD9 foci.
Figure 4
Figure 4. Interaction between the N-terminal region of WRN and the 9.1.1 complex via RAD1
(A) The N-terminal region of WRN interacts with RAD1. GST-tagged peptides corresponding to the N-, H-, and C- regions of the WRN protein were purified from E. coli and incubated with 5μg of HeLa nuclear extracts (NE). After separation on SDS-PAGE, the presence of RAD9 and RAD1 in the pull-down material was assessed by immunoblotting using the corresponding antibodies. The 5% of total NE was loaded as input. Coomassie Blue (CB) staining was used to show the equal input of the GST-tagged WRN fragments. (B) Far western analysis of the WRN interaction with the 9.1.1 complex. Recombinant 9.1.1 complex was separated using SDS-PAGE and blotted onto nitrocellulose membrane. Ponceau staining shows equal loading and transfer between the lanes (left panel). Single lanes were incubated with: no probe (lane 1), purified Flag-14-3-3 (lane 2) or purified Flag-WRN (lane 3) and subjected to immunoblotting using anti-Flag antibody to detect association of WRN to 9.1.1 complex (right panel). (C) Schematic representation of the N-terminal sub-fragments of WRN used to map the 9.1.1 interaction site. (D) Association between the different N-terminal sub-fragments of WRN and RAD1. GST-tagged peptides corresponding to the five different N-terminal sub-fragments were purified from E. coli and incubated with in-vitro-translated (IVT) 35S-labelled RAD1. After separation on SDS-PAGE and blotting, the presence of RAD1 in the pull-down material was assessed by autoradiography. Ponceau red staining of the blot shows the amount of N-terminal sub-fragments used in the pull-down analysis. Incubation of IVT 35S-labelled RAD1 with GST or beads alone was used as a control. Boxes indicate the identity and position of each fragment. (E) GST-tagged peptides corresponding to the five different N-terminal sub-fragments were purified from E. coli and incubated with 2μg of HeLa nuclear extracts. After separation on SDS-PAGE, the presence of RAD1 in the pull-down material was assessed by immunoblotting using an anti-RAD1 antibody. The 1/5 of total NE was loaded as input. Ponceau red staining of the blot shows the amount of N-terminal sub-fragments used in the pull-down analysis. Boxes indicate the identity and position of each fragment.
Figure 5
Figure 5. Impaired WRN relocalisation in nuclear foci and association with 9.1.1 complex in cells expressing a WRN mutant bearing a deletion in the RAD1-bindign region
(A) Western blotting on extracts from WS cells stably expressing the Flag-tagged wild-type WRN (WRNwt) or the 112-121 deletion mutant (WRNdel) showing levels of WRN using an anti-WRN antibody. WS cells were used as a negative control and tubulin as loading control. (B) Analysis of the association with 9.1.1 of the WRN mutant protein with deletion in the 9.1.1-binding region. Five μg of wild-type or 112-121 deletion mutant GST-tagged N-terminal fragment of WRN (1-550) was purified from E. coli and incubated with 2μg of HeLa nuclear extracts. After release in sample buffer and separation on SDS-PAGE, the presence of RAD1 in the pull-down material was assessed by immunoblotting using an anti-RAD1 antibody. One-tenth of the released material was subjected to immunoblotting using an anti-GST antibody to visualize the amount of GST-NWRN fragments. Pull-down using uncoupled GST-binding beads was used as negative control. (C) Analysis of WRN relocalisation to nuclear foci after replication arrest. Images show WRN nuclear distribution with or without an 8h HU treatment. The inset shows the percentage of WRN positive nuclei. Data are presented as means of three independent experiments+/− standard errors. (D) Analysis of WRN-9.1.1 association in cells expressing WRNdel. 293T cells transiently expressing the Flag-tagged WRNwt or the Flag-tagged WRNdel protein were treated with 2mM HU for 8h prior to lysis and immunoprecipitation using anti-Flag antibody. The presence of RAD9 and RAD1 were assessed by immunoblotting (IB) using the indicated antibodies. Immunoprecipitation using normal IgG was used as a negative control. Inputs contained 15% of the total lysates used for immunoprecipitation. A fraction of the lysate (1/50) was also analysed by immunoblotting to evaluate the amount of the wild-type and mutant form of WRN expressed in 293T cells. RAD9 immunoblotting was used to confirm the presence of RAD9 in the lysates and as loading control. (E) Analysis of WRN phosphorylation at S/TQ sites in the 112-121 deletion WRN mutant after HU treatment. Cells expressing the wild-type and the WRNdel mutant were treated with 2mM HU for 6h prior to lysis and immunoprecipitation using an anti-Flag antibody. WRN phosphorylation was evaluated by immunoblotting in the WRN immunoprecipitates with an anti-pST/Q antibody (IB: pS/TQ). The total amount of the immunoprecipitated WRN protein was determined by anti-WRN immunobloting (IB: WRN). Immunoprecipitation using normal mouse IgG (IgG) was used as a negative control.
Figure 6
Figure 6. Enhanced levels of DNA damage in WS cells in which RAD9 function was abrogated
(A) Analysis of γ-H2AX foci in WSWRN (wild-type) or WS in which RAD9 function was depleted. Cells were transfected with siRNAs directed against GFP (siCtrl) or RAD9 (siRAD9) and 48h afterwards were exposed for 3h or 6h to HU prior to immunofluorescence with anti- γ-H2AX antibody. In the panel, representative images from the untreated or HU-treated cells are shown. Graphs show quantification of the nuclei presenting γ-H2AX focal staining after HU treatment in WSWRN cells (left graph) or WS cells (right graph). (B) The graph shows the γ-H2AX fluorescence intensity. The experiment was carried out as described in (A). (C) Evaluation of cell viability by LIVE/DEAD assay. WS and WSWRN cells were transfected with siRNAs directed against GFP (siCtrl) or RAD9 (siRAD9) and treated with HU for 24h at the indicated doses. Cell viability was evaluated as described in “Materials and Methods”. Data are presented as percent of dead cells. (D) FA-D2 and FA-D2 cells complemented with the FANCD2 protein (FA-D2+FANCD2) were transfected with siRNAs directed against GFP (siCtrl) or WRN (siWRN) and treated with HU for 24h at the indicated doses. Cell viability was evaluated as described in “Materials and Methods”. Data are presented as percent of dead cells. Data are presented as means of three independent experiments. Error bars represent standard errors.
Figure 7
Figure 7. Evaluation of chromosomal damage in response to aphidicolin in WRN- and RAD9-depleted cells
Average overall chromosome gaps and breaks per cell in WSWRN (wild-type) cells in which WRN, RAD9 or WRN/RAD9 were down-regulated by RNAi. Cells were treated with different doses of aphidicolin (Aph) and harvested 24h later. Representative Giemsa-stained metaphases of cells treated or not with 0.2μM aphidicolin are reported. Insets show an enlarged portion of the metaphases for a better evaluation of chromosomal gaps or breaks. (B) Average overall chromosome gaps and breaks per cell in WS cells stably transfected with the wild-type form of WRN (WRNwt) or the WRNdel mutant (WRNdel). Cells were treated with different doses of aphidicolin (Aph) and harvested 24h later. Data are presented as means of three independent experiments. Error bars represent standard error.

Similar articles

Cited by

References

    1. Ammazzalorso F, Pirzio LM, Bignami M, Franchitto A, Pichierri P. ATR and ATM differently regulate WRN to prevent DSBs at stalled replication forks and promote replication fork recovery. EMBO J. 2010;29:3156–3169. - PMC - PubMed
    1. Bao S, Lu T, Wang X, Zheng H, Wang LE, Wei Q, et al. Disruption of the Rad9/Rad1/Hus1 (9-1-1) complex leads to checkpoint signaling and replication defects. Oncogene. 2004;23:5586–5593. - PubMed
    1. Blander G, Zalle N, Daniely Y, Taplick J, Gray MD, Oren M. DNA damage-induced translocation of the Werner helicase is regulated by acetylation. J Biol Chem. 2002;277:50934–50940. - PubMed
    1. Brosh RM, Jr., Waheed J, Sommers JA. Biochemical characterization of the DNA substrate specificity of Werner syndrome helicase. J Biol Chem. 2002;277:23236–23245. - PubMed
    1. Cheng WH, von Kobbe C, Opresko PL, Fields KM, Ren J, Kufe D, et al. Werner syndrome protein phosphorylation by abl tyrosine kinase regulates its activity and distribution. Mol Cell Biol. 2003;23:6385–6395. - PMC - PubMed

Publication types

MeSH terms