. 2012 Jan 4;31(1):162-74.
doi: 10.1038/emboj.2011.367. Epub 2011 Oct 14.

A syn-anti conformational difference allows SRSF2 to recognize guanines and cytosines equally well

Affiliations

A syn-anti conformational difference allows SRSF2 to recognize guanines and cytosines equally well

Gerrit M Daubner et al. EMBO J. .

Abstract

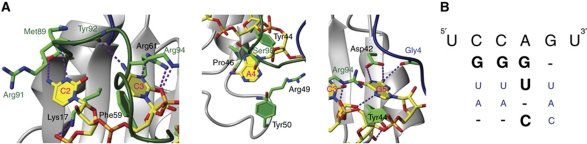
SRSF2 (SC35) is a key player in the regulation of alternative splicing events and binds degenerated RNA sequences with similar affinity in nanomolar range. We have determined the solution structure of the SRSF2 RRM bound to the 5'-UCCAGU-3' and 5'-UGGAGU-3' RNA, both identified as SRSF2 binding sites in the HIV-1 tat exon 2. RNA recognition is achieved through a novel sandwich-like structure with both termini forming a positively charged cavity to accommodate the four central nucleotides. To bind both RNA sequences equally well, SRSF2 forms a nearly identical network of intermolecular interactions by simply flipping the bases of the two consecutive C or G nucleotides into either anti or syn conformation. We validate this unusual mode of RNA recognition functionally by in-vitro and in-vivo splicing assays and propose a 5'-SSNG-3' (S=C/G) high-affinity binding consensus sequence for SRSF2. In conclusion, in addition to describe for the first time the RNA recognition mode of SRSF2, we provide the precise consensus sequence to identify new putative binding sites for this splicing factor.


Conflict of interest statement

The authors declare that they have no conflict of interest.

Figures

Figure 1
Figure 1
Solution structure of the SRSF2 RRM (aa 1–101) in the free state. (A) Schematic representation of the full-length SRSF2. The protein is shown with the amino-acid sequence of the RRM used in these studies. The β-strands are coloured in orange, α-helices in red and both conserved RNP motifs are underlined. Numbering is according to the PDB sequence. (B) Backbone traces (N, Cα and C′) of the 20 lowest energy structures of the free-state SRSF2 RRM (aa 1--101) superimposed on the backbone of the structured part (aa 10–93). Protein backbone of the RRM (aa 15–90) in grey, N-terminus (aa 1–14) in blue and C-terminus (aa 91–101) in dark green. (C) Ribbon structure of the free-state SRSF2 RRM. Characteristic residues are in stick representation, coloured green for carbon, red for oxygen and blue for nitrogen. (D) Close-up view on the hinge between β-strand 1 and the N-terminus with the same colour code than for (C) plus yellow for sulphur. Hydrogen bonds are presented as violet dashed lines. Figures (BD) were generated with MOLMOL (Koradi et al, 1996).
Figure 2
Figure 2
Overview of the SRSF2 RRM binding to the 5′-UCCAGU-3′ RNA. (A) Overlay of 1H-15N HSQC spectra representing an NMR titration of 15N-labelled SRSF2 RRM with unlabelled 5′-UCCAGU-3′ RNA. The peaks corresponding to the free and RNA-bound protein states (RNA:protein ratio 1:1) are in blue and red. Negative peaks are coloured green. Arrows indicate chemical shift perturbations higher than 0.5 p.p.m. (B) Mapping of the combined chemical shift perturbations (Δδ=[(δHN)2+(δN/6.41)2]1/2) upon RNA binding over the amino-acid residue number. The position of the secondary structure elements is shown above the graph. The largest chemical shift perturbations (>0.5 p.p.m.) are indicated. The largest shift for Arg91 (*) can only be seen in a construct without HIS tag (Supplementary Figure S1). (C) Binding affinity of SRSF2 RRM for the 5′-UCCAGU-3′ RNA measured by ITC. Raw data and corresponding binding curve are depicted. Mean value for the dissociation constant (Kd) with standard deviation is based on three independent measurements. (D) Backbone traces (N, Cα and C') of the 20 lowest energy structures of the SRSF2 RRM (1–101) in complex with the 5′-UCCAGU-3′ RNA superimposed on the backbone of the structured part. The protein backbone is coloured as in Figure 1B. The central motif of the RNA is shown in stick representation, with the carbon atoms in yellow, nitrogen in blue, phosphate in orange and oxygen in red; the two non-defined flanking uracils were omitted for better overview. Amino acids 1–6 and 94–101 are omitted in the 45° rotated view. (E) Surface representation in stereo view of the most representative structure, with the protein backbone in ribbon and the 5′-UCCAGU-3′ RNA in sticks. Important protein side chains involved in RNA interaction are represented as sticks. Colour code as in Figure 1B and D. Figures (D, E) were generated with MOLMOL (Koradi et al, 1996).
Figure 3
Figure 3
Specificity of the interaction between SRSF2 and the 5′-UCCAGU-3′ RNA. (A) Close-up view of the four central nucleotides C2, C3, A4 and G5 as described in Figure 2D. Hydrogen bonds are presented as violet dashed lines. Figure was generated with MOLMOL (Koradi et al, 1996). (B) Affinity matrix obtained by ITC measurements. Nucleotides in big bold letters have no effect on binding affinity and small blue letters decrease binding affinity more than five-fold when compared with the original sequence 5′-UCCAGU-3′.
Figure 4
Figure 4
Overview of SRSF2 RRM binding to the 5′-UGGAGU-3′ RNA. (A) Binding affinity of SRSF2 RRM to the 5′-UGGAGU-3′ RNA measured by ITC, as described in Figure 2C. (B) Backbone traces of the 20 lowest energy structures of the SRSF2 RRM in complex with the 5′-UGGAGU-3′ RNA superimposed on the backbone of the structured part, as described in Figure 2D. (C) Surface representation (stereo view) of the most representative structure, as described in Figure 2E. (D) Close-up view of the semi-specifically recognized G2 and G3 as described in Figure 2D. Figures (BD) were generated with MOLMOL (Koradi et al, 1996).
Figure 5
Figure 5
Effect of nucleotide substitutions in the 5′-UCCAGU-3′ motif on SRSF2 splicing activity in vitro. (A) Scheme of the Sp1 ‘inverted exon 2’ reporter, adapted from Dreumont et al (2010). A test sequence containing the SELEX-derived S94 RNA was inserted into exon 2 and tested for splicing activation. (B) In-vitro splicing assays using cytoplasmic S100 and nuclear extract (ratio 4:1) with the Sp1 ‘inverted exon 2’ splicing substrate. Each transcript embodied the SELEX-derived S94 sequence in exon 2 with various point mutations in the 5′-UCCAGU-3′ SRSF2 binding site. After normalization, the ratio for splicing activation of the respective negative control was subtracted for each sample. Mean value and standard deviation of three independent experiments are shown below. Colours are as described in Figure 3B, with low-affinity mutants in small blue and high-affinity mutants in big bold letters. (C) Graphical depiction of mean value and standard deviation for each transcript. The dashed blue line illustrates the residual splicing activity of the control.
Figure 6
Figure 6
Effect of point mutations in the SRSF2 RNA binding interface on its splicing activity in vivo. (A) Scheme of the pSC35-βGlo minigene, adapted from Dreumont et al (2010). The 3′-terminal intronic and exonic region of the SRSF2 gene was cloned into the rabbit β-globin intron 2. (B) RNA analysis of in-vivo splicing assays after RT–PCR. The minigene was co-transfected into HeLa cells, overexpressing various SRSF2 mutants. Splicing activation by SRSF2 led to an increased use of the 3′ splice site of the SRSF2 terminal exon compared with the β-globin 3′ splice site. Mean value and standard deviation of three independent experiments are shown below the gel. (C) Graphical depiction of mean value and standard deviation for each SRSF2 mutant.

References

    1. Allain FH, Gubser CC, Howe PW, Nagai K, Neuhaus D, Varani G (1996) Specificity of ribonucleoprotein interaction determined by RNA folding during complex formulation. Nature 380: 646–650 - PubMed
    1. Arrisi-Mercado P, Romano M, Muro AF, Baralle FE (2004) An exonic splicing enhancer offsets the atypical GU-rich 3′ splice site of human apolipoprotein A-II exon 3. J Biol Chem 279: 39331–39339 - PubMed
    1. Auweter SD, Oberstrass FC, Allain FH (2006) Sequence-specific binding of single-stranded RNA: is there a code for recognition? Nucleic Acids Res 34: 4943–4959 - PMC - PubMed
    1. Ballatore C, Lee VM, Trojanowski JQ (2007) Tau-mediated neurodegeneration in Alzheimer's disease and related disorders. Nat Rev Neurosci 8: 663–672 - PubMed
    1. Barash Y, Calarco JA, Gao W, Pan Q, Wang X, Shai O, Blencowe BJ, Frey BJ (2010) Deciphering the splicing code. Nature 465: 53–59 - PubMed

Publication types

MeSH terms