. 2012 Feb;13(1):17-28.
doi: 10.1007/s10162-011-0296-x. Epub 2011 Oct 15.

Effects of low-frequency biasing on otoacoustic and neural measures suggest that stimulus-frequency otoacoustic emissions originate near the peak region of the traveling wave

Affiliations

Effects of low-frequency biasing on otoacoustic and neural measures suggest that stimulus-frequency otoacoustic emissions originate near the peak region of the traveling wave

Jeffery T Lichtenhan. J Assoc Res Otolaryngol. 2012 Feb.

Abstract

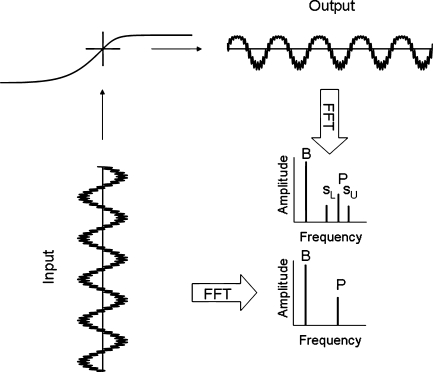
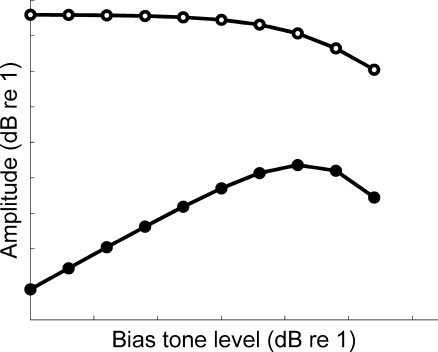
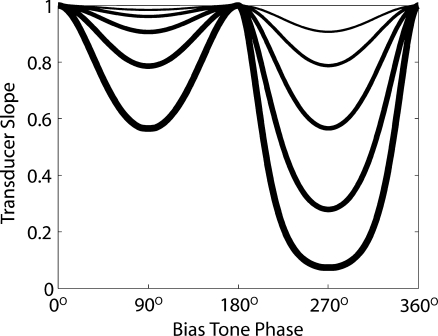
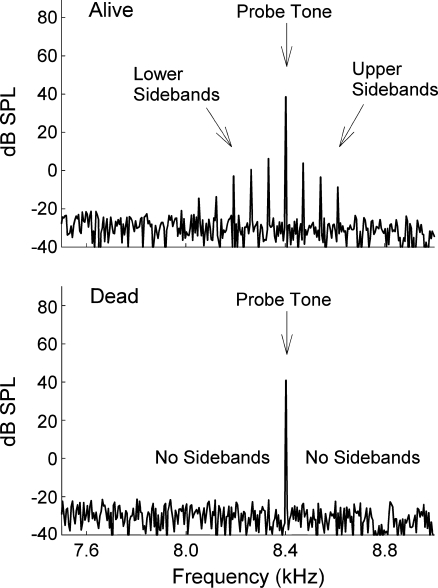
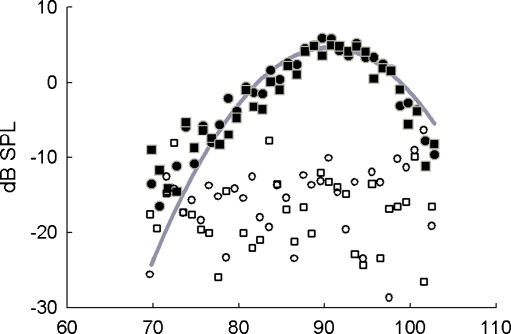
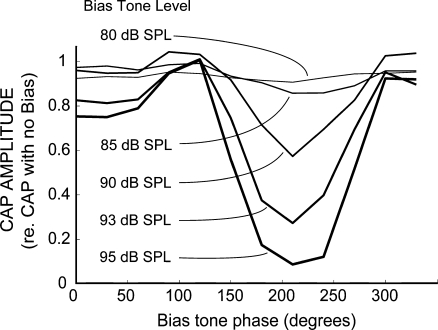
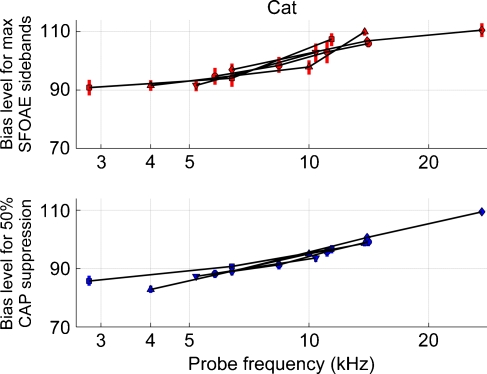
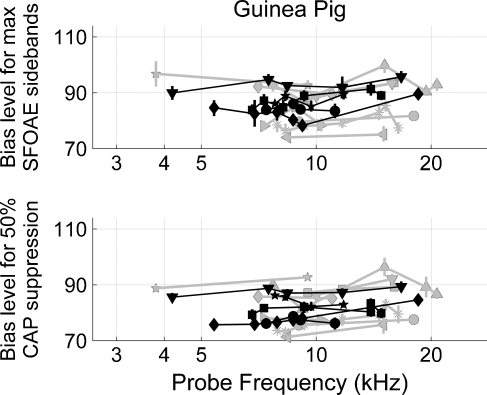
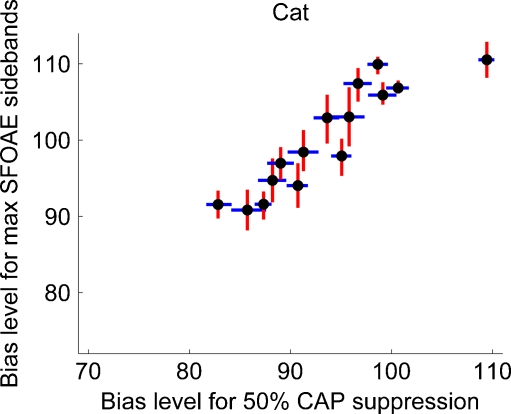
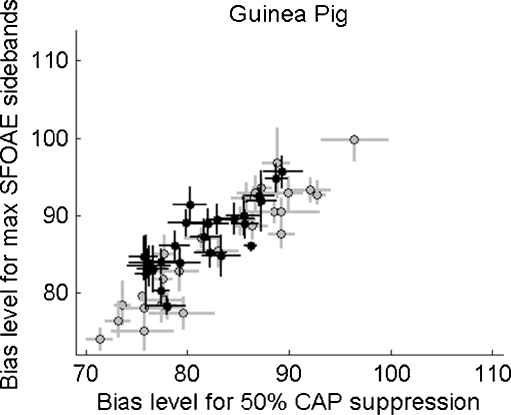
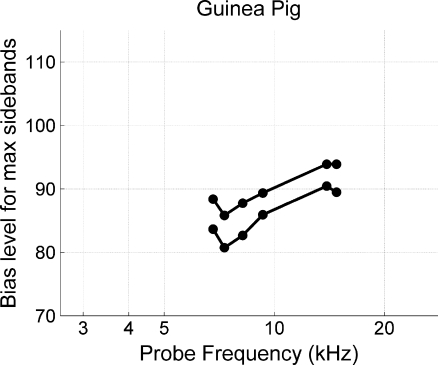
Stimulus-frequency otoacoustic emissions (SFOAEs) have been used to study a variety of topics in cochlear mechanics, although a current topic of debate is where in the cochlea these emissions are generated. One hypothesis is that SFOAE generation is predominately near the peak region of the traveling wave. An opposing hypothesis is that SFOAE generation near the peak region is deemphasized compared to generation in the tail region of the traveling wave. A comparison was made between the effect of low-frequency biasing on both SFOAEs and a physiologic measure that arises from the peak region of the traveling wave--the compound action potential (CAP). SFOAE biasing was measured as the amplitude of spectral sidebands from varying bias tone levels. CAP biasing was measured as the suppression of CAP amplitude from varying bias tone levels. Measures of biasing effects were made throughout the cochlea. Results from cats show that the level of bias tone needed for maximum SFOAE sidebands and for 50% CAP reduction increased as probe frequency increased. Results from guinea pigs show an irregular bias effect as a function of probe frequency. In both species, there was a strong and positive relationship between the bias level needed for maximum SFOAE sidebands and for 50% CAP suppression. This relationship is consistent with the hypothesis that the majority of SFOAE is generated near the peak region of the traveling wave.


Figures

FIG. 1
FIG. 1
The essence of our modeling efforts for one level of a low-frequency bias tone. In the lower left, a low-frequency bias tone and higher frequency probe tone are shown as mechanical input to the model transducer function in the upper left. The model transducer function represents the outer hair cell input–output function with mechanical drive on the x-axis and outer hair cell current on the y-axis. The output in the upper right shows distortion in the time domain. The lower right illustrates that the output in the frequency domain has a bias tone (B), probe tone (P), and lower and upper sidebands (sL and sU). In contrast, the input has no sidebands.
FIG. 2
FIG. 2
Amplitude of modeled sidebands (filled symbols) and probe output (open symbols) as a function of bias tone level. The sidebands resulted from amplitude modulation of the probe tone. The sideband growth was governed by the gain, or slope, of the transducer function. The decline of the sidebands, as well as the probe tone at the output, was also governed by the morphology of the transducer function. This is a guide to our interpretation of our physiologic SFOAE biasing experiment described below.
FIG. 3
FIG. 3
The slope of the model transducer function throughout one cycle of the low-frequency bias tone. Twice each biasing cycle, the gain of the probe tone was suppressed. Amount of suppression was bias level-dependent. Line thickening represents increasing bias tone level. This guides our interpretation of physiologic CAP biasing experiments shown below: since cochlear amplifier gain depends on the slope of the transducer function, a variation of cochlear amplifier suppression produces varying amounts CAP amplitude reduction.
FIG. 4
FIG. 4
Example ear canal spectra from when a cat was living (upper panel) and dead (lower panel). For these examples, only one 50 Hz bias tone level was presented though it is not seen on this scale. The bias tone amplitude modulated the SFOAE generated by the probe tone and produced sidebands visible in the frequency domain. For the experiments reported here, only the first-order sidebands (i.e., probe frequency ± the bias tone frequency) were considered.
FIG. 5
FIG. 5
Example cat SFOAE sidebands as a function of bias level. Amplitudes of lower (i.e., probe tone frequency − bias tone frequency) sidebands from a living animal are represented by filled circles while upper (i.e., probe tone frequency + bias tone frequency) sidebands are represented as filled squares. The unfilled symbols are the corresponding sidebands from a dead animal. The thick gray line is a second-order polynomial fit to the region of maximum SFOAE sidebands. For this example, the probe tone frequency was 2.803 kHz and the bias level producing maximum SFOAE sidebands was 90.8 dB SPL according to the quadratic fit.
FIG. 6
FIG. 6
Example cat CAP amplitude as a function of bias tone phase and level. Lines connect CAP peak-to-peak amplitude measures obtained from different levels and phases of the bias tone. The lines thicken slightly to help illustrate increasing bias level. The amount of CAP suppression varied with the level and phase of the bias tone. For this example, 50% suppression occurred at a bias tone level of 91 dB SPL and phase of 210°. The tone-pip frequency was 6.399 kHz.
FIG. 7
FIG. 7
The upper panel shows the bias level (dB SPL) that produced maximum SFOAE sidebands as a function of probe frequency. Different symbols represent different cat ears. Vertical error bars are the width of the sideband versus bias level curves (e.g., Fig. 2) measured 0.5 dB down from the maximum. The lower panel shows the bias level (dB SPL) that produced 50% CAP suppression as a function of frequency. CAP biasing was done at the same probe frequencies as SFOAE biasing. These cat SFOAE and CAP data show a systematic trend that, as compared to lower frequencies, greater bias levels were needed to produce maximum SFOAE sidebands and CAP suppression at higher frequencies.
FIG. 8
FIG. 8
The upper panel shows the bias level (dB SPL) that produced maximum SFOAE sidebands as a function of probe frequency. Vertical error bars are the width of the sideband versus bias level curves (e.g., Fig. 2) measured 0.5 dB down from the maximum. Data obtained with a 150 Hz bias tone are in gray (nine ears from eight guinea pigs) while data obtained with either a 50 Hz or 70 Hz bias tone are in black (five ears from five different guinea pigs). Different symbols represent different guinea pig ears. Lines connect data collected from a given ear. The lower panel shows the low-frequency bias tone level (dB SPL) needed to achieve 50% CAP suppression as a function of frequency. Vertical error bars are estimates of 40% and 60% CAP suppression. Unlike the cat data, guinea pig data do not show a systematic trend with frequency.
FIG. 9
FIG. 9
The bias level (dB SPL) needed to achieve maximum SFOAE sidebands as a function of bias level needed to achieve 50% CAP suppression. The vertical error bars are the width of the SFOAE sideband versus bias level function (i.e., same as in the upper panel of Fig. 7). Likewise, the horizontal error bars are estimates of 40% and 60% CAP suppression (i.e., same as in the lower panel of Fig. 7). This is the relation we interpret to suggest that cat SFOAE and CAPs are both generated near the peak region of the travelling wave.
FIG. 10
FIG. 10
The bias level (dB SPL) needed to achieve maximum SFOAE sidebands as a function of bias level needed to achieve 50% CAP suppression. The vertical error bars are the widths of the SFOAE sideband versus bias level function (i.e., same as in the upper panel of Fig. 8). The horizontal error bars are estimates of 40% and 60% CAP suppression (i.e., same as in the lower panel of Fig. 8). Gray data are from 150 Hz biasing while black data are from 50 Hz and 70 Hz biasing. This relation is what we believe illustrates that guinea pig SFOAE and CAPs are generated in the same cochlear place—the traveling wave peak region.
FIG. 11
FIG. 11
Bias level (dB SPL) needed to produce maximum SFOAE sidebands as a function of time for two different cats (red) and two different guinea pigs (black). The probe tones were 9.091 kHz (black edge) and 6.399 kHz (no black edge) for the cats and 6.799 kHz (filled symbol) and 7.898 kHz (non-filled symbol) for the guinea pigs. The vertical error bars indicate the width of the sideband versus bias level function measured 0.5 dB down from the maximum. The cats show very little (i.e., less than 1 dB) variation throughout the duration when these measures were made. In contrast, the guinea pig data varied by roughly 8 to 9 dB. For reasons yet to be understood, cat cochleae were stable using our surgical preparation and our experimental protocol, though guinea pig cochleae were not stable.
FIG. 12
FIG. 12
Bias level (dB SPL) needed to produce maximum SFOAE sidebands as a function of probe tone frequency. On two different instances separated by approximately 4 h and 13 min, we simultaneously presented six probe tones along with a bias tone that varied in level. The set of data with lower y-axis values was recorded first. This allowed us to see that guinea pig cochleae show the trend seen in the cat data—higher bias levels needed for higher probe frequencies—for each moment in time.

Similar articles

Cited by

References

    1. Bentsen T, Harte JM, Dau T. Human cochlear tuning estimates from stimulus-frequency otoacoustic emissions. J Acoust Soc Am. 2011;129:3797–3807. doi: 10.1121/1.3575596. - DOI - PubMed
    1. Bian L, Watts KL. Effects of low-frequency biasing on spontaneous otoacoustic emissions: amplitude modulation. J Acoust Soc Am. 2008;123:887–898. doi: 10.1121/1.2821983. - DOI - PMC - PubMed
    1. Brass D, Kemp DT. Suppression of stimulus frequency otoacoustic emissions. J Acoust Soc Am. 1993;93:920–939. doi: 10.1121/1.405453. - DOI - PubMed
    1. Brown DJ, Hartsock JJ, Gill RM, Fitzgerald HE, Salt AN. Estimating the operating point of the cochlear transducer using low-frequency biased distortion products. J Acoust Soc Am. 2009;125:2129–2145. doi: 10.1121/1.3083228. - DOI - PMC - PubMed
    1. Cai Y, Geisler CD. Suppression in auditory-nerve fibers of cats using low-side suppressors. III. Model results. Hear Res. 1996;96:126–140. doi: 10.1016/0378-5955(96)00036-6. - DOI - PubMed

Publication types

LinkOut - more resources