. 2011 Oct;70(4):657-61.
doi: 10.1002/ana.22509. Epub 2011 Oct 14.

Amyloid-β associated volume loss occurs only in the presence of phospho-tau

Affiliations

Amyloid-β associated volume loss occurs only in the presence of phospho-tau

Rahul S Desikan et al. Ann Neurol. 2011 Oct.

Abstract

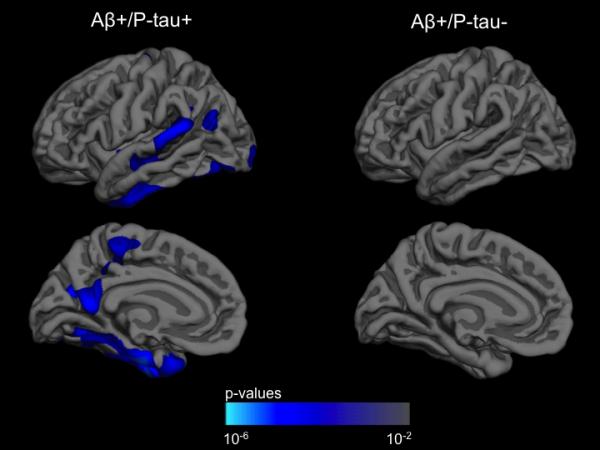
The relationship between neurodegeneration and the 2 hallmark proteins of Alzheimer's disease, amyloid-β (Aβ) and tau, is still unclear. Here, we examined 286 nondemented participants (107 cognitively normal older adults and 179 memory impaired individuals) who underwent longitudinal magnetic resonance (MR) imaging and lumbar puncture. Using mixed effects models, we investigated the relationship between longitudinal entorhinal cortex atrophy rate, cerebrospinal fluid (CSF) p-tau(181p) and CSF Aβ(1-42) . We found a significant relationship between elevated entorhinal cortex atrophy rate and decreased CSF Aβ(1-42) only with elevated CSF p-tau(181p) . Our findings indicate that Aβ-associated volume loss occurs only in the presence of phospho-tau in humans at risk for dementia.


Figures

Figure 1
Figure 1
Diagrammatic representations of the primary hypotheses evaluated in the current study: (β1) main effect of p-tau on entorhinal cortex atrophy, (β2) main effect of Aβ on entorhinal cortex atrophy, and (β3 and formula image
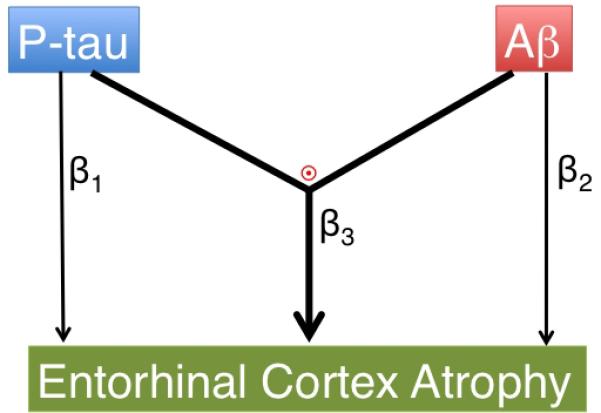
) an interactive effect between p-tau and Aβ is associated with entorhinal cortex atrophy.
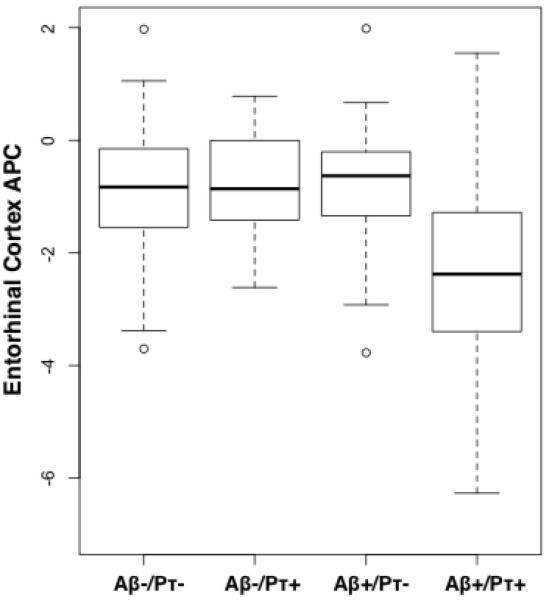
Figure 2
Figure 2
(a) Box and whisker plots for all participants illustrating entorhinal cortex atrophy rate, measured as annualized percent change (APC), based on CSF Aβ1-42 (Aβ) and CSF p-tau181p (pτ) status for all participants. For each plot, thick black lines show the median value. Regions above and below the black line show the upper and lower quartiles, respectively. The dashed lines extend to the minimum and maximum values with outliers shown as open circles. As illustrated, the Aβ +/pτ + individuals demonstrated the largest cortical atrophy rate (i.e. more negative percent change). (b) ANCOVA results for all participants displayed across the lateral and medial hemispheres of the cerebral cortex. The cortex-wide ANCOVA co-varied for age, gender, group status (MCI vs. HC) and CDR-SB. The strongest association between CSF Aβ1-42 status and cortical atrophy rate, measured as annualized percent change, was observed in the entorhinal/medial temporal cortex and present only among p-tau positive individuals. Among p-tau negative individuals, CSF Aβ1-42 status was not associated with rate of cortical atrophy. For illustration, only the left hemisphere is visualized.
Figure 2
Figure 2
(a) Box and whisker plots for all participants illustrating entorhinal cortex atrophy rate, measured as annualized percent change (APC), based on CSF Aβ1-42 (Aβ) and CSF p-tau181p (pτ) status for all participants. For each plot, thick black lines show the median value. Regions above and below the black line show the upper and lower quartiles, respectively. The dashed lines extend to the minimum and maximum values with outliers shown as open circles. As illustrated, the Aβ +/pτ + individuals demonstrated the largest cortical atrophy rate (i.e. more negative percent change). (b) ANCOVA results for all participants displayed across the lateral and medial hemispheres of the cerebral cortex. The cortex-wide ANCOVA co-varied for age, gender, group status (MCI vs. HC) and CDR-SB. The strongest association between CSF Aβ1-42 status and cortical atrophy rate, measured as annualized percent change, was observed in the entorhinal/medial temporal cortex and present only among p-tau positive individuals. Among p-tau negative individuals, CSF Aβ1-42 status was not associated with rate of cortical atrophy. For illustration, only the left hemisphere is visualized.

References

    1. Hardy J, Selkoe DJ. Science. 2002;297:353–6. - PubMed
    1. Spires-Jones TL, et al. Am J Patho. 2007;l 171:1304–11. - PMC - PubMed
    1. Kuchibhotla KV, et al. Neuron. 2008;59:214–225. - PMC - PubMed
    1. Crystal H, et al. Neurology. 1988;38:1682–7. - PubMed
    1. Arriagada PV, et al. Neurology. 1992;42:631–9. - PubMed

Publication types