. 2012 Jan 15;21(2):394-405.
doi: 10.1093/hmg/ddr474. Epub 2011 Oct 14.

Gcn5 loss-of-function accelerates cerebellar and retinal degeneration in a SCA7 mouse model

Affiliations

Gcn5 loss-of-function accelerates cerebellar and retinal degeneration in a SCA7 mouse model

Yi Chun Chen et al. Hum Mol Genet. .

Abstract

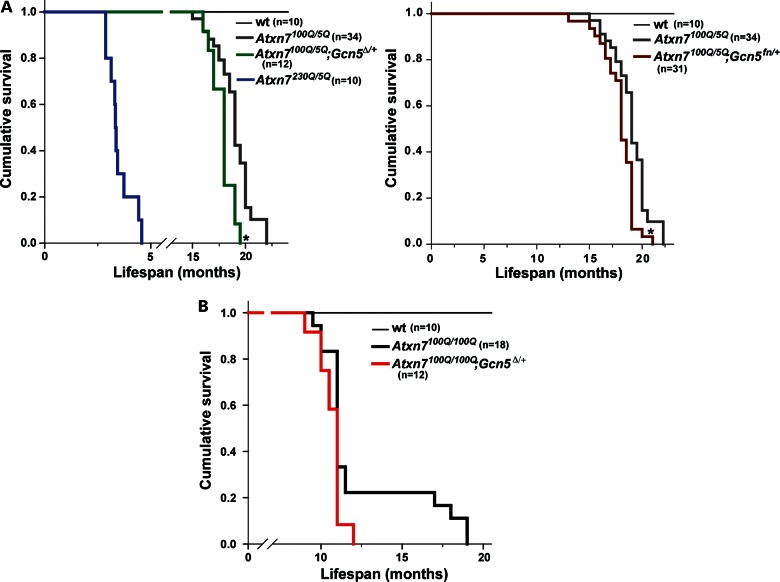
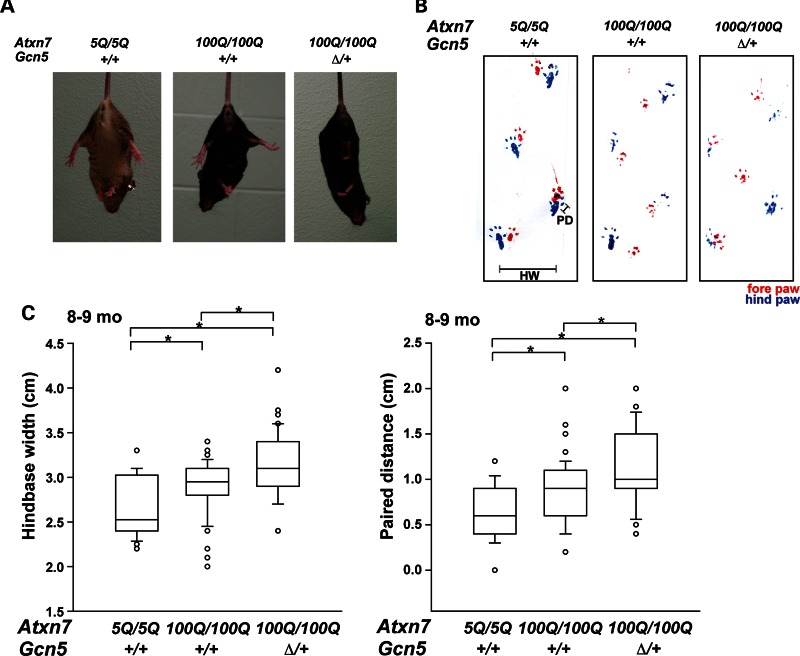
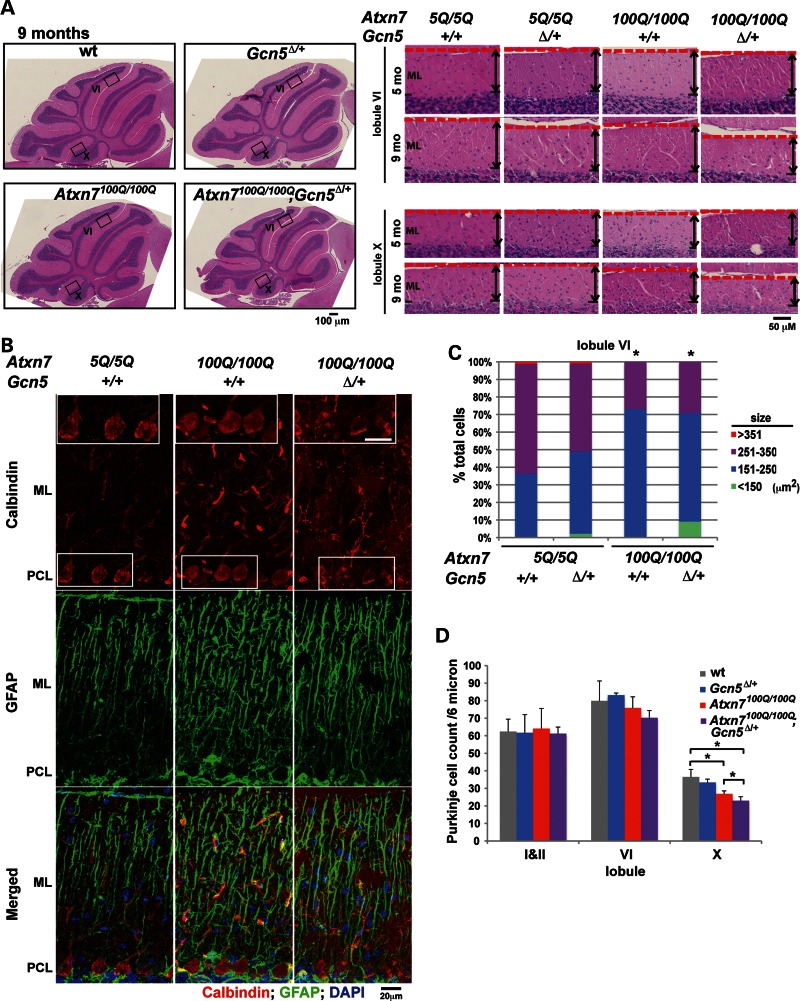
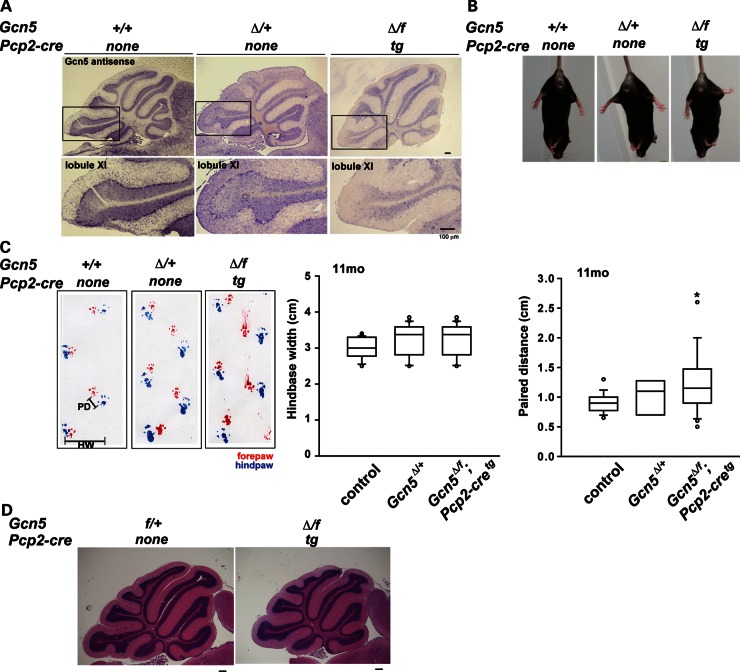
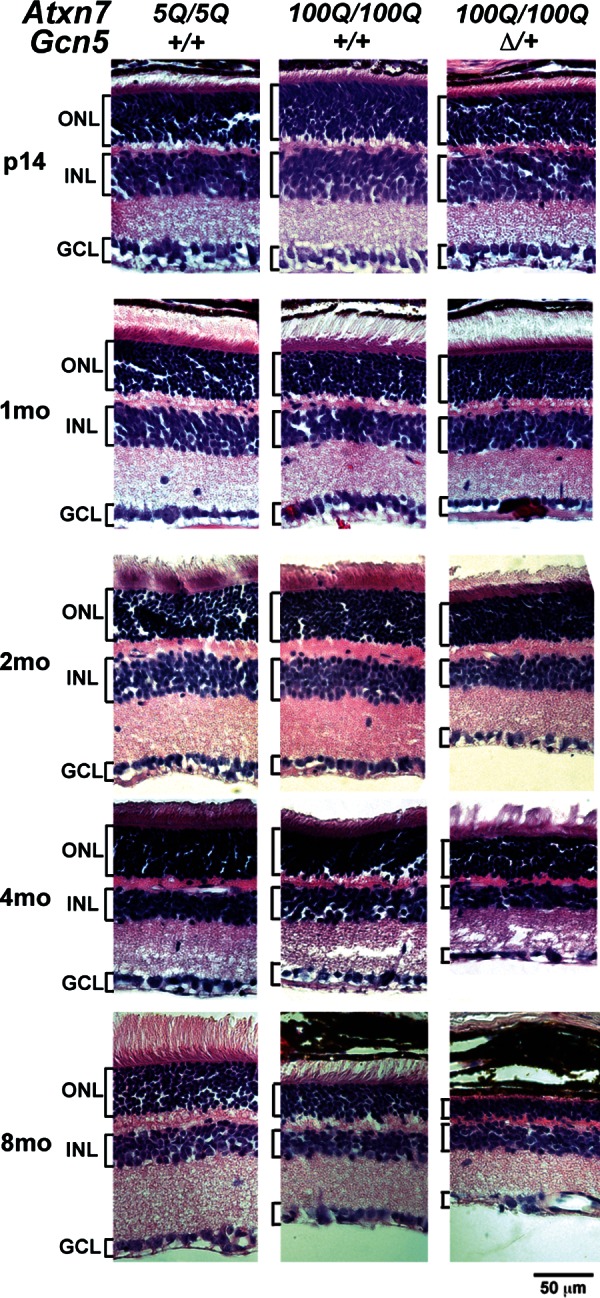
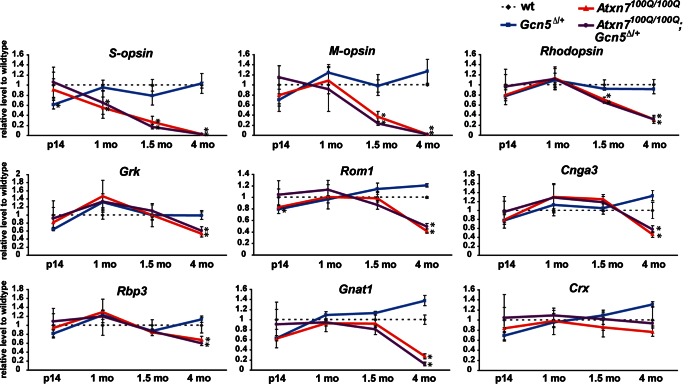
Spinocerebellar ataxia type 7 (SCA7) is a neurodegenerative disease caused by expansion of a CAG repeat encoding a polyglutamine tract in ATXN7, a component of the SAGA histone acetyltransferase (HAT) complex. Previous studies provided conflicting evidence regarding the effects of polyQ-ATXN7 on the activity of Gcn5, the HAT catalytic subunit of SAGA. Here, we report that reducing Gcn5 expression accelerates both cerebellar and retinal degeneration in a mouse model of SCA7. Deletion of Gcn5 in Purkinje cells in mice expressing wild-type (wt) Atxn7, however, causes only mild ataxia and does not lead to the early lethality observed in SCA7 mice. Reduced Gcn5 expression strongly enhances retinopathy in SCA7 mice, but does not affect the known transcriptional targets of Atxn7, as expression of these genes is not further altered by Gcn5 depletion. These findings demonstrate that loss of Gcn5 functions can contribute to the time of onset and severity of SCA7 phenotypes, and suggest that non-transcriptional functions of SAGA may play a role in neurodegeneration in this disease.


Figures

Figure 1.
Figure 1.
Gcn5 mutation reduces lifespan of 100Q-Atxn7 mice. (A) Survival rate of wt (thin black line), Atxn7230Q/5Q (blue line), Atxn7100Q/5Q (gray line) and Atxn7100Q/5Q; Gcn5Δ/+ (green line), until 24 months of age (wt, n = 10; Atxn7230Q/5Q, n = 10; Atxn7100Q/5Q, n = 34; Atxn7100Q/5Q; Gcn5Δ/+, n = 12; *P < 0.05 between Atxn7100Q/5Q and Atxn7100Q/5Q; Gcn5Δ/+, Kaplan–Meier analysis). Survival rate of Atxn7100Q/5Q; Gcn5fn/+ (dark red line) until 24 months of age is also shown (n = 31; *P < 0.05 between Atxn7100Q/5Q and Atxn7100Q/5Q; Gcn5fn/+, Kaplan–Meier analysis). (B) Survival rate of wt (thin black line), Atxn7100Q/100Q (thick black line) and Atxn7100Q/100Q; Gcn5Δ/+ (red line), until 24 months of age (wt, n = 10; Atxn7100Q/100Q, n = 18; Atxn7100Q/100Q; Gcn5Δ/+, n = 12; Kaplan–Meier analysis).
Figure 2.
Figure 2.
Reducing the level of Gcn5 enhances ataxia phenotypes of Atxn7100Q/100Q mice. (A) Clasping phenotype of Atxn7100Q/100Q; Gcn5Δ/+ but not Atxn7100Q/100Q or wt mice at 9 month of age during tail suspension. (B) Representative traces of the gait of wt, Atxn7100Q/100Q and Atxn7100Q/100Q; Gcn5Δ/+ mice recorded by footprint analysis, with red and blue footprints representing fore- and hind-paws, respectively. Uncoordinated gait of Atxn7100Q/100Q or Atxn7100Q/100Q; Gcn5Δ/+ mice at 9 months of age. Paired distance (PD) measures the distance between the prints of fore- and hind-paw on the same side. Hind-base width (HW) measures the distance between the prints of the two hind-paws. (C) Quantified HW or PD indicates Atxn7100Q/100Q; Gcn5Δ/+ mice have more uncoordinated walking gaits than Atxn7100Q/100Q mice at 9 months of age (wt, n = 3; Atxn7100Q/100Q, n = 4; Atxn7100Q/100Q; Gcn5Δ/+, n = 3; *P < 0.05 between wt and Atxn7100Q/100Q, wt and Atxn7100Q/100Q; Gcn5Δ/+, or Atxn7100Q/100Q and Atxn7100Q/100Q; Gcn5Δ/+, Kruskal–Wallis test). Data are expressed as box plots (boxes, 25–75%; circles, < 10 or >90%; lines, median).
Figure 3.
Figure 3.
Cerebellar degeneration is more severe in Atxn7100Q/100Q animals in a background of Gcn5Δ/+. (A) Severe atrophy of molecular layer (ML) in lobule VI and X of mid-saggital cerebellar vermis of Atxn7100Q/100Q; Gcn5Δ/+. Representative images showing morphology of mid-sagittal cerebellar vermis of 9-month-old wt, Atxn7100Q/100Q and Atxn7100Q/100Q; Gcn5Δ/+ mice (n ≥ 3 mice of each genotype). Boxes of areas in lobule VI and X of 5- and 9-month-old mice were enlarged for detailed comparison. Thickness of ML was marked. (B) Anti-Calbindin 28K and Glial fibrillary acidic protein (GFAP) antibody immunofluorescent-labeled Purkinje cells and Bergmann glia, respectively, in cerebellar lobule VI of mice of indicated genotype. Areas containing soma of Purkinje cells were enlarged in the insets. (C) Area size frequency of Purkinje cell soma shows Atxn7100Q/100Q and Atxn7100Q/100Q; Gcn5Δ/+ mice have smaller soma (wt, n = 3 mice; Atxn7100Q/100Q, n = 3; Atxn7100Q/100Q; Gcn5Δ/+, n = 2; *P < 0.05 between wt and Atxn7100Q/100Q, or wt and Atxn7100Q/100Q; Gcn5Δ/+, Student's t-test). (D) Purkinje cell number is significantly less in lobule X of Atxn7100Q/100Q and Atxn7100Q/100Q; Gcn5Δ/+ mice (wt, n = 5 mice; Atxn7100Q/100Q, n = 4; Atxn7100Q/100Q; Gcn5Δ/+, n = 3; *P < 0.05 between wt and Atxn7100Q/100Q, or wt and Atxn7100Q/100Q; Gcn5Δ/+, or Atxn7100Q/100Q and Atxn7100Q/100Q; Gcn5Δ/+, Student's t-test). Data are presented as mean ± SEM. PCL, Purkinje cell layer.
Figure 4.
Figure 4.
Purkinje cell-specific loss of Gcn5 causes mild ataxia and cerebellar degeneration. (A) In situ hybridization for Gcn5 transcripts shows decreased Gcn5 expression in the Purkinje cell layer in Gcn5Δ/f;Pcp2-creTg mice compared with wt or Gcn5Δ/+ mice at postnatal day 21. (B) Coordinated hind limb stretching during tail suspension of wt, Gcn5Δ/+ and Gcn5Δ/f;Pcp2-creTg mice at 11 months of age. (C) Abnormal gait of Gcn5-conditional null mice at 11 months of age. Walking gait was recorded by footprint analysis with red and blue footprints representing fore- and hind-paws, respectively. Quantified footprints show Gcn5Δ/f;Pcp2-creTg mice have wider paired distance (n = 3 mice each genotype; *P < 0.05 between wt and Gcn5Δ/f;Pcp2-creTg, Kruskal–Wallis test). Data are expressed as box plots (boxes, 25–75%; circles, <10% or >90%; lines, median). (D) Representative H&E staining shows morphology of cerebellar vermis of 9-month-old control and Gcn5Δ/f;Pcp2-creTg mice.
Figure 5.
Figure 5.
Reducing Gcn5 worsens retinal degeneration in Atxn7100Q/100Q mice. Representative images show progressively thinner retina in Atxn7100Q/100Q; Gcn5Δ/+ mice at 2, 4 and 8 months of age, whereas mice of all genotypes have similar retinal structures at P14 using H&E staining (n = 3 mice each genotype). OS, outer segment; IS, inner segment; ONL, outer nuclear layer; INL, inner nuclear layer; GCL, ganglion cell layer.
Figure 6.
Figure 6.
Gradual decrease of SCA7 target transcripts in both Atxn7100Q/100Q and Atxn7100Q/100Q; Gcn5Δ/+ mice. Relative transcript levels to wt (dotted line) in the retinas of Gcn5Δ/+ (blue line), Atxn7100Q/100Q (red line) and Atxn7100Q/100Q; Gcn5Δ/+ (purple line) mice at P14, 1, 1.5 and 4 months of age (n = 3 mice of each genotype, *P < 0.05 between wt and Atxn7100Q/100Q or wt and Atxn7100Q/100Q; Gcn5Δ/+; Student's t-test). Data are presented as mean ± SD.

Similar articles

Cited by

References

    1. David G., Abbas N., Stevanin G., Durr A., Yvert G., Cancel G., Weber C., Imbert G., Saudou F., Antoniou E., et al. Cloning of the SCA7 gene reveals a highly unstable CAG repeat expansion. Nat. Genet. 1997;17:65–70. - PubMed
    1. David G., Durr A., Stevanin G., Cancel G., Abbas N., Benomar A., Belal S., Lebre A.-S., Abada-Bendib M., Grid D., et al. Molecular and clinical correlations in autosomal dominant cerebellar ataxia with progressive macular dystrophy (SCA7) Hum. Mol. Genet. 1998;7:165–170. - PubMed
    1. Del-Favero J., Krols L., Michalik A., Theuns J., Löfgren A., Goossens D., Wehnert A., Van den Bossche D., Van Zand K., Backhovens H., et al. Molecular genetic analysis of autosomal dominant cerebellar ataxia with retinal degeneration (ADCA Type II) caused by CAG triplet repeat expansion. Hum. Mol. Genet. 1998;7:177–186. - PubMed
    1. Johansson J., Forsgren L., Sandgren O., Brice A., Holmgren G., Holmberg M. Expanded CAG repeats in Swedish spinocerebellar ataxia type 7 (SCA7) patients: effect of CAG repeat length on the clinical manifestation. Hum. Mol. Genet. 1998;7:171–176. - PubMed
    1. Giunti P., Stevanin G., Worth P.F., David G., Brice A., Wood N.W. Molecular and clinical study of 18 families with ADCA type ii: evidence for genetic heterogeneity and de novo mutation. Am. J. Hum. Genet. 1999;64:1594–1603. - PMC - PubMed

Publication types