. 2011 Oct;23(10):3696-710.
doi: 10.1105/tpc.111.090753. Epub 2011 Oct 14.

Actin interacting protein1 and actin depolymerizing factor drive rapid actin dynamics in Physcomitrella patens

Affiliations

Actin interacting protein1 and actin depolymerizing factor drive rapid actin dynamics in Physcomitrella patens

Robert C Augustine et al. Plant Cell. 2011 Oct.

Abstract

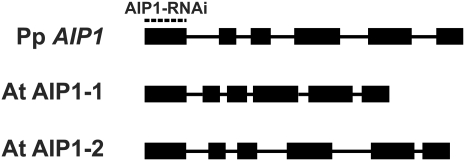
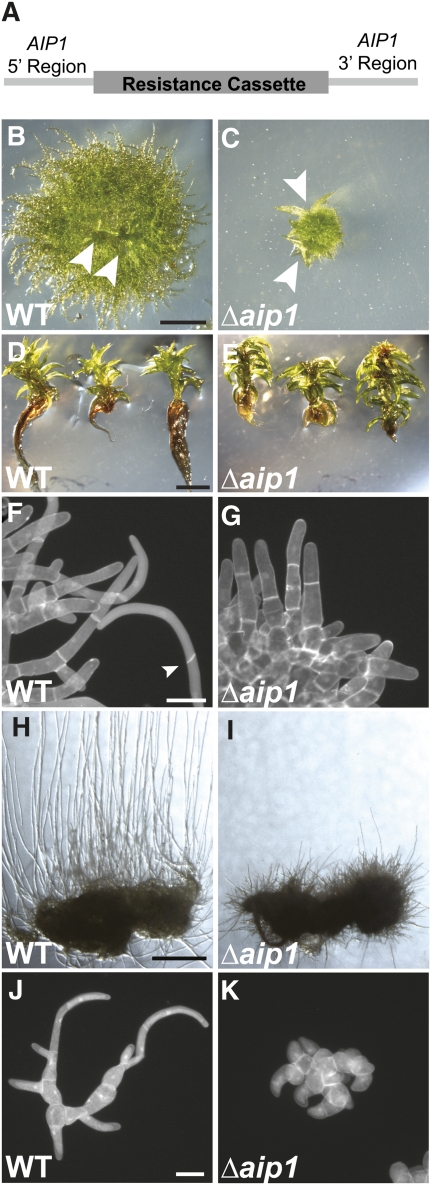
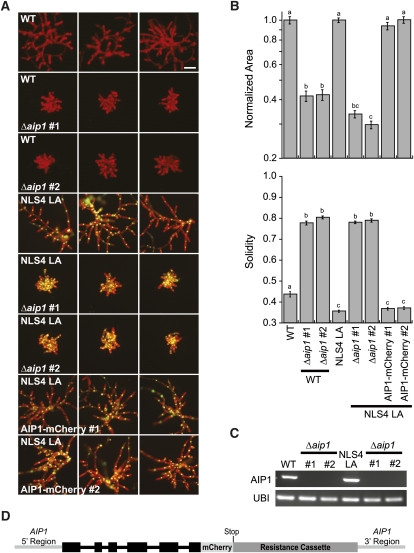
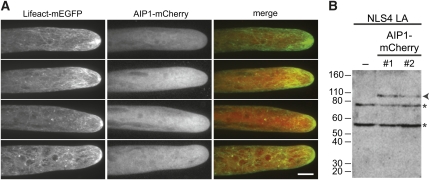
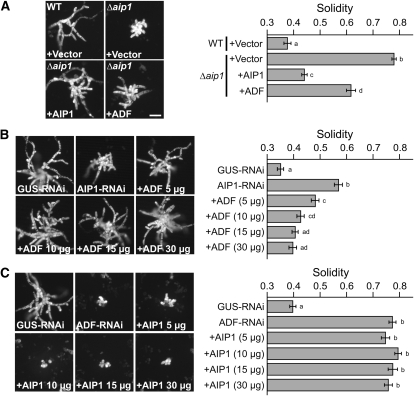
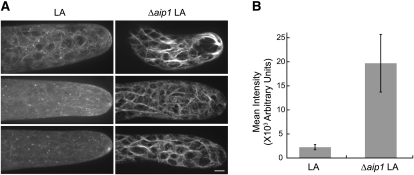
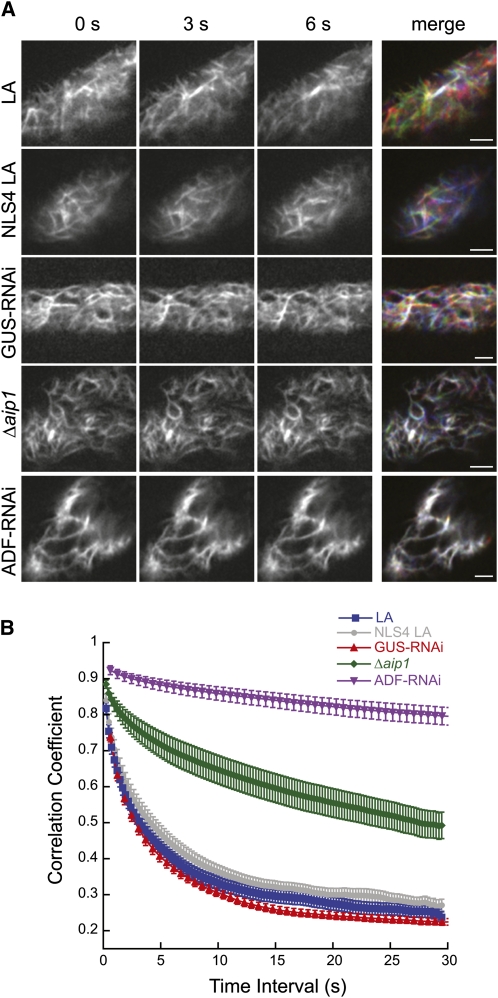
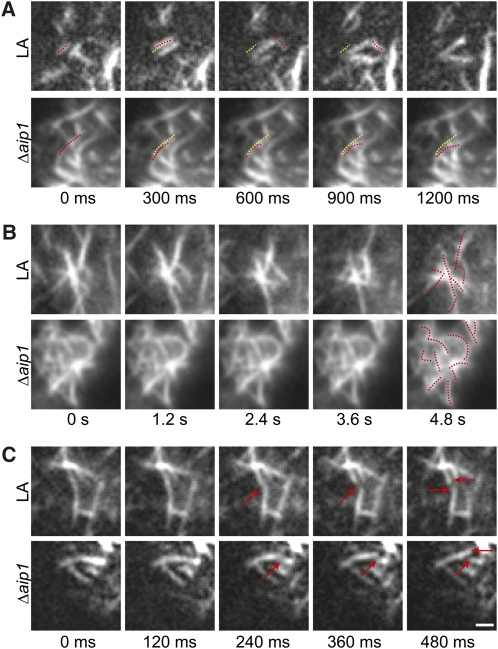
The remodeling of actin networks is required for a variety of cellular processes in eukaryotes. In plants, several actin binding proteins have been implicated in remodeling cortical actin filaments (F-actin). However, the extent to which these proteins support F-actin dynamics in planta has not been tested. Using reverse genetics, complementation analyses, and cell biological approaches, we assessed the in vivo function of two actin turnover proteins: actin interacting protein1 (AIP1) and actin depolymerizing factor (ADF). We report that AIP1 is a single-copy gene in the moss Physcomitrella patens. AIP1 knockout plants are viable but have reduced expansion of tip-growing cells. AIP1 is diffusely cytosolic and functions in a common genetic pathway with ADF to promote tip growth. Specifically, ADF can partially compensate for loss of AIP1, and AIP1 requires ADF for function. Consistent with a role in actin remodeling, AIP1 knockout lines accumulate F-actin bundles, have fewer dynamic ends, and have reduced severing frequency. Importantly, we demonstrate that AIP1 promotes and ADF is essential for cortical F-actin dynamics.


Figures

Figure 1.
Figure 1.
Schematic of P. patens and Arabidopsis AIP1 Gene Structures. Exons are thick black boxes; introns are black lines. Intron-exon boundaries were determined by comparing genomic and cDNA sequences. The sequence used for the AIP1 coding sequence-RNAi (AIP1-RNAi) is indicated by a dashed line above the first exon.
Figure 2.
Figure 2.
AIP1 Promotes the Growth and Formation of Tip-Growing Cells. (A) The AIP1 knockout construct was generated by PCR amplifying a sequence upstream of the start codon (5′ region) and downstream of the stop codon (3′ region) as targeting arms for homologous recombination. The targeting arms flank a resistance cassette to select for AIP1 knockout plants. (B) and (C) Wild-type (WT) (B) or Δaip1 (C) plants were grown on cellophane-overlain agar plates for 3 weeks. Arrowheads point to emerging gametophores. Bar = 1 mm. (D) and (E) Wild-type (D) or Δaip1 (E) plants were grown on agar plates for 3 months. Plants were removed from the agar and laid on an agar plate to display the growth of the gametophores and rhizoids. Bar = 2 mm. (F) and (G) Plants were stained with calcofluor and DAPI to image cell walls and nuclei, respectively, and then visualized by epifluorescence microscopy. Apical cell length in 8-d-old wild type (F) and Δaip1 (G) plants was measured from fluorescence images (Table 1). The arrowhead points to an oblique cell plate of a caulonemal cell. Bar = 50 μm. (H) and (I) Wild-type (H) and Δaip1 (I) plants were grown on a cellophane-overlaid agar plate for 18 d in the dark. Bar = 2 mm. (J) and (K) The number of cells per plant was measured in 5-d-old plants stained with calcofluor and DAPI to image cell walls and nuclei, respectively. Wild-type (J) and Δaip1 (L) plants were visualized by epifluorescence microscopy. Bar = 50 μm.
Figure 3.
Figure 3.
Growth and Morphology Are Affected in AIP1 Knockout Plants. (A) Representative images of 1-week-old plants visualized by epifluorescence stereomicroscopy. Two independent Δaip1 lines are compared with their respective control plants: the wild type (WT) or a line stably coexpressing NLS-GFP-GUS and LA (NLS4 LA). Green nuclei are a result of the NLS-GFP-GUS signal. Two independent lines expressing a C-terminal fusion of AIP1-mCherry at the endogenous locus in the NLS4 LA line are shown. Bar = 100 μm. (B) Quantification of normalized area and solidity in control and allele replacement lines. Normalization was done in relation to the appropriate control (the wild type or NLS4). Letters above the bars indicate statistical groupings. Numbers of plants analyzed: the wild type, 75; wild-type Δaip1 #1, 52; wild-type Δaip1 #2, 74; NLS4 LA, 175; NLS4 LA Δaip1 #1, 100; NLS4 LA Δaip1 #2, 100; NLS4 LA AIP1-mCherry 1, 75; NLS4 LA AIP1-mCherry 2, 75. Error bars indicate se. (C) RNA expression analysis of control and Δaip1 lines. Representative ethidium bromide–stained gel of RT-PCR analysis using protonemal RNA samples from the indicated lines. Ubiquitin10 is a loading control. Two biological replicates and four technical replicates were performed. (D) Schematic of the AIP1-mCherry replacement locus. Exons are thick black boxes. Introns are black lines. The stop codon was removed from the end of original coding sequence and moved to the end of the mCherry sequence to generate an in-frame C-terminal fusion protein. Light-gray lines are regions upstream of the start codon (AIP1 5′ region) and downstream of the stop codon (AIP1 3′ region) in the unaltered PpAIP1 locus.
Figure 4.
Figure 4.
AIP1 Is Diffusely Cytosolic. (A) Z-projections of four NLS4 LA AIP1-mCherry protonemal cells imaged with spinning disc confocal microscopy. LA (a marker for actin), AIP1-mCherry, and merge of both channels are shown. Bar = 10 μm. (B) Fifteen micrograms of protonemal cell protein extracts from control and NLS4 LA AIP1-mCherry replacement lines were immunoblotted with a polyclonal dsRed antibody. The arrowhead points to the AIP1-mCherry protein band, while asterisks indicate cross-reactive bands present in all samples.
Figure 5.
Figure 5.
AIP1 Functions through ADF. (A) Representative images of 1-week-old plants imaged with epifluorescence microscopy. On each panel, the top left-hand corner indicates the stable line, and the transformed plasmid is indicated in the bottom left-hand corner. Ten micrograms of plasmid was used in the transformation of each line. The number of plants analyzed is as follows: the wild type (WT) +Vector, 75; Δaip1 +Vector, 100; Δaip1 +AIP1, 75; Δaip1 +ADF, 75. (B) Representative images of 1-week-old plants imaged with epifluorescence microscopy. AIP1-RNAi was cotransformed with various concentrations of the complementing ADF plasmid, indicated after the plus sign. The number of plants analyzed is 75 for all samples. (C) Representative images of 1-week-old plants imaged with epifluorescence microscopy. ADF-RNAi was cotransformed with various concentrations of the complementing AIP1 plasmid indicated after the plus sign. The number of plants analyzed is as follows: GUS-RNAi, 75; ADF-RNAi, 75; +AIP1 5 μg, 75; +AIP1 10 μg, 75; +AIP1 15 μg, 50; +AIP1 30 μg, 75. In (A) to (C), the red channel, representing chlorophyll autofluorescence, was extracted from the color image and converted to gray scale. Solidity values for each rescue are indicated in the graph on the right. Error bars represent se. Letters to the right of the bar indicate statistical groupings. For all images, bar = 100 μm.
Figure 6.
Figure 6.
Actin Is Highly Bundled in AIP1 Knockout Cells. (A) Three representative images of LA obtained with spinning disc confocal microscopy from LA wild-type (LA) and LA Δaip1 plant (Δaip1) cells. Note the enhanced bundling of actin filaments in AIP1 knockout cells. Images are maximal projections of 0.5-μm sections spanning the cortex to the medial plane. All images were acquired using the same imaging settings. Bar = 5 μm. (B) Quantification of the extent of bundling is shown for control (LA) and Δaip1 lines. The amount of bundling was measured by taking three perpendicular line scans at ~20, 40, and 60 μm from the cell tip. The peaks in the line scan represent actin filaments/bundles. Integration of the area under the peak corresponds to the fluorescence intensity of the labeled actin structure. The number of images analyzed is as follows: LA, 8; Δaip1 8. Error bars represent se.
Figure 7.
Figure 7.
AIP1 and ADF Promote in Vivo Actin Dynamics. (A) Actin dynamics at the cortex of protonemal cells were visualized by time-lapse spinning disc confocal microscopy (GUS-RNAi and ADF-RNAi) or VAEM (LA, NLS4 LA, and Δaip1) using the actin probe LA. Representative images of actin are shown as grayscale images representing red, green, and blue for the 0-, 3-, and 6-s time points, respectively. The merge combines all time points as separate color channels projected onto one RGB image. White indicates overlap of actin in all time points; color indicates that actin has changed in at least one of the three time points. All images were equivalently adjusted through background subtraction, enhanced contrast, and smoothing in ImageJ. Bars = 2.5 μm. (B) The correlation coefficient between images was calculated at all temporal spacings (time interval). Low correlation values correspond with higher actin dynamics. The number of plants analyzed is as follows: LA, 18; NLS4 LA, 13; NLS4 LA Δaip1, 24; NLS4 LA GUS-RNAi, 18; NLS4 LA ADF-RNAi, 18. Error bars represent se.
Figure 8.
Figure 8.
Cortical F-Actin Remodeling Is Slower in the AIP1 Knockout Than in the Wild Type. (A) Translocation event. Dotted red line shows position of the filament of interest at each time point. Dotted yellow line shows the position of the filament at 0 s. (B) Rearrangements near a cluster of filaments. Dotted red lines show the position of the filaments at 0 s in the final time point. (C) Severing event. Red arrows indicate severed filament and filament ends. Bar = 2.5 μm.

References

    1. Aizawa H., Katadae M., Maruya M., Sameshima M., Murakami-Murofushi K., Yahara I. (1999). Hyperosmotic stress-induced reorganization of actin bundles in Dictyostelium cells over-expressing cofilin. Genes Cells 4: 311–324 - PubMed
    1. Allwood E.G., Anthony R.G., Smertenko A.P., Reichelt S., Drobak B.K., Doonan J.H., Weeds A.G., Hussey P.J. (2002). Regulation of the pollen-specific actin-depolymerizing factor LlADF1. Plant Cell 14: 2915–2927 - PMC - PubMed
    1. Andrianantoandro E., Pollard T.D. (2006). Mechanism of actin filament turnover by severing and nucleation at different concentrations of ADF/cofilin. Mol. Cell 24: 13–23 - PubMed
    1. Augustine R.C., Vidali L., Kleinman K.P., Bezanilla M. (2008). Actin depolymerizing factor is essential for viability in plants, and its phosphoregulation is important for tip growth. Plant J. 54: 863–875 - PubMed
    1. Balcer H.I., Goodman A.L., Rodal A.A., Smith E., Kugler J., Heuser J.E., Goode B.L. (2003). Coordinated regulation of actin filament turnover by a high-molecular-weight Srv2/CAP complex, cofilin, profilin, and Aip1. Curr. Biol. 13: 2159–2169 - PubMed

Publication types

MeSH terms

Associated data