

Impact of exercise to improve gait efficiency on activity and participation in older adults with mobility limitations: a randomized controlled trial
- PMID: 22003158
- PMCID: PMC3229041
- DOI: 10.2522/ptj.20100391
Impact of exercise to improve gait efficiency on activity and participation in older adults with mobility limitations: a randomized controlled trial
Abstract
Background: Definitive evidence that exercise interventions that improve gait also reduce disability is lacking. A task-oriented, motor sequence learning exercise intervention has been shown to reduce the energy cost of walking and improve gait speed, but whether the intervention also improves activity and participation has not been demonstrated.
Objective: The objective of this study was to compare the impact of a task-oriented, motor sequence learning exercise (TO) intervention and the impact of an impairment-oriented, multicomponent exercise (IO) intervention on activity and participation outcomes in older adults with mobility limitations. The mediating effects of a change in the energy cost of walking on changes in activity and participation also were determined.
Design: This study was a single-blind, randomized controlled trial. Setting The study was conducted in an ambulatory clinical research training center.
Participants: The study participants were 47 older adults (mean age=77.2 years, SD=5.5) with slow and variable gait. Intervention The intervention was a 12-week, physical therapist-guided program of TO or IO.
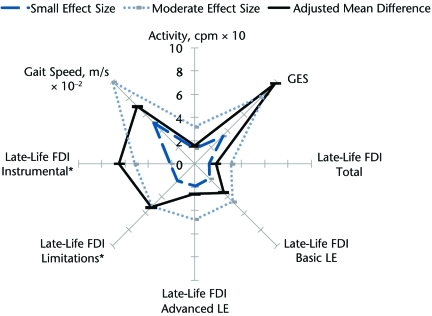
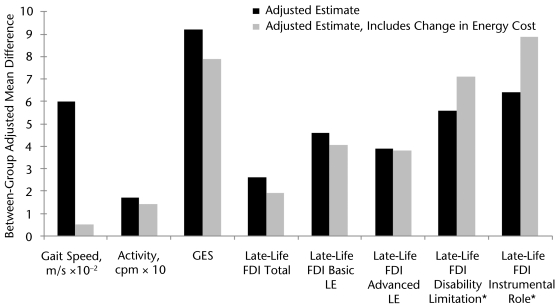
Measurements: Measures of activity (gait speed over an instrumented walkway; daily physical activity measured with an accelerometer; confidence in walking determined with the Gait Efficacy Scale; and physical function determined with the total, basic lower-extremity, and advanced lower-extremity components of the Late-Life Function and Disability Instrument [Late-Life FDI]) and participation (disability limitation dimension and instrumental role [home and community task performance] domain components of the Late-Life FDI) were recorded before and after the intervention. The energy cost of walking was determined from the rate of oxygen consumption during self-paced treadmill walking at the physiological steady state standardized by walking speed. An adjusted comparison of activity and participation outcomes in the treatment arms was made by use of an analysis of covariance model, with baseline and change in energy cost of walking added to the model to test for mediation. Tests were used to determine the significance of the mediating effects.
Results: Activity improved in TO but not in IO for confidence in walking (Gait Efficacy Scale; mean adjusted difference=9.8 [SD=3.5]) and physical function (Late-Life FDI basic lower-extremity component; mean adjusted difference=3.5 [SD=1.7]). Improvements in TO were marginally greater than those in IO for gait speed, physical activity, and total physical function. Participation improved marginally more in TO than in IO for disability limitations and instrumental role.
Limitations: The older adults were randomized to the intervention group, but differences in baseline measures had to be accounted for in the analyses.
Conclusions: A TO intervention that improved gait also led to improvements in some activity and participation outcomes in older adults with mobility limitations.
Trial registration: ClinicalTrials.gov NCT00177359.
Figures
Similar articles
-
Effect of Timing and Coordination Training on Mobility and Physical Activity Among Community-Dwelling Older Adults: A Randomized Clinical Trial.JAMA Netw Open. 2022 May 2;5(5):e2212921. doi: 10.1001/jamanetworkopen.2022.12921. JAMA Netw Open. 2022. PMID: 35604689 Free PMC article. Clinical Trial.
-
Program to improve mobility in aging (PRIMA) study: Methods and rationale of a task-oriented motor learning exercise program.Contemp Clin Trials. 2020 Feb;89:105912. doi: 10.1016/j.cct.2019.105912. Epub 2019 Dec 12. Contemp Clin Trials. 2020. PMID: 31838258 Free PMC article.
-
Perceived effort of walking: relationship with gait, physical function and activity, fear of falling, and confidence in walking in older adults with mobility limitations.Phys Ther. 2012 Oct;92(10):1268-77. doi: 10.2522/ptj.20110326. Epub 2012 Jun 21. Phys Ther. 2012. PMID: 22723433 Free PMC article.
-
Comparing Two Types of Exercise Classes to Help Older Adults Improve Walking Ability [Internet].Washington (DC): Patient-Centered Outcomes Research Institute (PCORI); 2018 Mar. Washington (DC): Patient-Centered Outcomes Research Institute (PCORI); 2018 Mar. PMID: 36924509 Free Books & Documents. Review.
-
Effects of physical exercise on physical and mental health in older adults with gait disorders: A systematic review.Geriatr Nurs. 2025 May-Jun;63:123-130. doi: 10.1016/j.gerinurse.2025.03.028. Epub 2025 Apr 3. Geriatr Nurs. 2025. PMID: 40184899
Cited by
-
Physical activity interventions among older adults: a literature review.Res Theory Nurs Pract. 2013;27(1):53-80. doi: 10.1891/1541-6577.27.1.53. Res Theory Nurs Pract. 2013. PMID: 23923347 Free PMC article. Review.
-
Effect of Timing and Coordination Training on Mobility and Physical Activity Among Community-Dwelling Older Adults: A Randomized Clinical Trial.JAMA Netw Open. 2022 May 2;5(5):e2212921. doi: 10.1001/jamanetworkopen.2022.12921. JAMA Netw Open. 2022. PMID: 35604689 Free PMC article. Clinical Trial.
-
Aging, the Central Nervous System, and Mobility in Older Adults: Interventions.J Gerontol A Biol Sci Med Sci. 2016 Nov;71(11):1451-1458. doi: 10.1093/gerona/glw080. Epub 2016 May 6. J Gerontol A Biol Sci Med Sci. 2016. PMID: 27154905 Free PMC article.
-
Computer Vision and Machine Learning-Based Gait Pattern Recognition for Flat Fall Prediction.Sensors (Basel). 2022 Oct 19;22(20):7960. doi: 10.3390/s22207960. Sensors (Basel). 2022. PMID: 36298311 Free PMC article.
-
The association between social participation and lower extremity muscle strength, balance, and gait speed in US adults.Prev Med Rep. 2016 Jun 7;4:142-7. doi: 10.1016/j.pmedr.2016.06.005. eCollection 2016 Dec. Prev Med Rep. 2016. PMID: 27413675 Free PMC article.
References
-
- Guralnik JM, Ferrucci L, Balfour JL, et al. Progressive versus catastrophic loss of the ability to walk: implications for the prevention of mobility loss. J Am Geriatr Soc. 2001;49:1463–1470 - PubMed
-
- Hausdorff JM, Edelberg HK, Mitchell SL, et al. Increased gait unsteadiness in community-dwelling elderly fallers. Arch Phys Med Rehabil. 1997;78:278–283 - PubMed
-
- Hausdorff JM, Rios DA, Edelberg HK. Gait variability and fall risk in community-living older adults: a 1-year prospective study. Arch Phys Med Rehabil. 2001;82:1050–1056 - PubMed
-
- Maki BE. Gait changes in older adults: predictors of falls or indicators of fear? J Am Geriatr Soc. 1997;45:313–320 - PubMed
