. 2011;6(10):e24281.
doi: 10.1371/journal.pone.0024281. Epub 2011 Oct 7.

Adenovirus gene transfer to amelogenesis imperfecta ameloblast-like cells

Affiliations

Adenovirus gene transfer to amelogenesis imperfecta ameloblast-like cells

Anton V Borovjagin et al. PLoS One. 2011.

Abstract

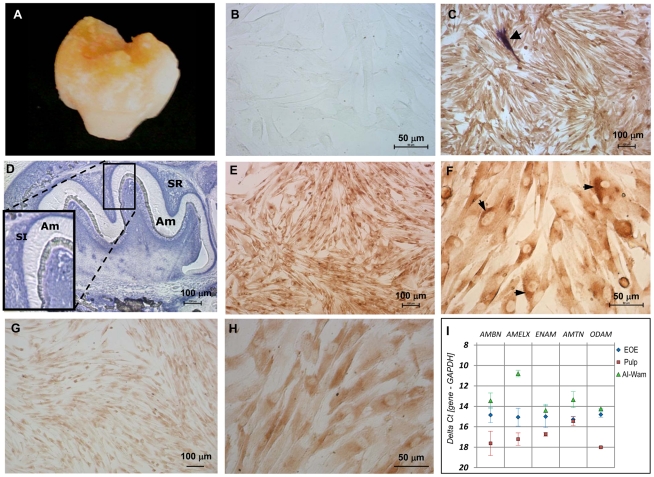
To explore gene therapy strategies for amelogenesis imperfecta (AI), a human ameloblast-like cell population was established from third molars of an AI-affected patient. These cells were characterized by expression of cytokeratin 14, major enamel proteins and alkaline phosphatase staining. Suboptimal transduction of the ameloblast-like cells by an adenovirus type 5 (Ad5) vector was consistent with lower levels of the coxsackie-and-adenovirus receptor (CAR) on those cells relative to CAR-positive A549 cells. To overcome CAR -deficiency, we evaluated capsid-modified Ad5 vectors with various genetic capsid modifications including "pK7" and/or "RGD" motif-containing short peptides incorporated in the capsid protein fiber as well as fiber chimera with the Ad serotype 3 (Ad3) fiber "knob" domain. All fiber modifications provided an augmented transduction of AI-ameloblasts, revealed following vector dose normalization in A549 cells with a superior effect (up to 404-fold) of pK7/RGD double modification. This robust infectivity enhancement occurred through vector binding to both α(v)β3/α(v)β5 integrins and heparan sulfate proteoglycans (HSPGs) highly expressed by AI-ameloblasts as revealed by gene transfer blocking experiments. This work thus not only pioneers establishment of human AI ameloblast-like cell population as a model for in vitro studies but also reveals an optimal infectivity-enhancement strategy for a potential Ad5 vector-mediated gene therapy for AI.


Conflict of interest statement

Competing Interests: The authors have declared that no competing interests exist.

Figures

Figure 1
Figure 1. Characterization of the human AI-ameloblast cell population by immunohistochemistry, ALP in situ histochemistry and qRT-PCR analysis.
A. Image of a tooth extracted from an AI patient that was used to establish an EOE primary cell culture. B. Phase contrast image of AI-WAm cell monolayer. C. AI-WAm cells stained for ALP activity followed by immunostaining for the epithelial marker cytokeratin 14; a single, highly ALP-positive cell is evident (arrow). D. Mouse molar stained for ALP activity showing ALP-negative secretory ameloblasts (Am) with highest activity (dark purple) in the stratum intermedium (SI) followed by the stellate reticulum (SR). Low (E) and high (F) magnification of AI-WAm cells positively stained for the major enamel protein Amel. Arrowheads on panel F indicate cells that appear polarized with unidirectional orientation of the Golgi apparatus. Low (G) and high (H) magnification of AI-WAm cells positively stained for the largest enamel protein Enam. I. Quantitative expression levels of the enamel matrix protein genes AMBN, AMELX, ENAM, AMTN and ODAM in AI-WAm cells relative to dental pulp and normal EOE cells as determined by RT-qPCR following normalization to a housekeeping gene GAPDH and presented as ΔΔCt values. Statistical analysis was carried out as described in Materials and Methods. Scale bars are: 50 µm (B, F, H), 100 µm (C, D, E, G).
Figure 2
Figure 2. Ad5 gene transfer to AI-WAm cells is limited by deficiency in expression and/or cell surface localization of the Ad5 receptor CAR.
A. Gene transfer efficiency of a human Ad5 vector expressing Luc reporter (Ad5 (L)) to an AI patient-derived ameloblast-like cells (AI-WAm) at different multiplicities of infection (MOI) (MOI = 10, 50 and 250 TCID50/cell) in comparison to CAR-positive A549 and CAR-negative RD cells by conventional Luc assay at 20 hours post infection. Results are presented in Relative Luc Units (RLU) per cell with mean values shown above each bar plus/minus standard deviation. All differences were statistically significant (P<0.05) B. Expression levels of hCAR mRNA in AI-WAm and A549 cells relative to that in RD cells as determined by qRT-PCR and presented as “fold difference”. All differences were statistically significant (P<0.05). P(A549/AI-WAm) = 0.027. C. Quantitative analysis of hCAR and hCD46 mRNA expression levels in RD, AI-WAm and A549 cells as determined by qRT-PCR and normalized to the housekeeping gene GAPDH. The data are presented as ΔΔCt values. For AI-WAm P(CAR/CD46) = 0.44; for A549 P(CAR/CD46) = 0.127; for RD P(CAR/CD46) = 0.007; for CAR P(AI-WAm/A549) = 0.049; P(RD/AI-WAm) = 0.033; for CD46 P(RD/AI-WAm) = 0.0011; P(AI-WAm/A549) = 0.0008. P-values for all other differences were <0.05. D. Flow cytometry analysis of Ad5 receptor (CAR) expression in AI-WAm cell population in comparison with CAR-positive (A549) and CAR-negative (RD) control cells. Cells were incubated with primary anti-CAR (RmcB) monoclonal antibody (Ab) followed by labeling with Alexa 488-conjugated secondary antibodies. No primary Ab was used in negative control samples. The extent of shift in the fluorescent peak positions (color lines) relative to control peak(s) of unlabeled cells (black dotted lines) reflects the extent of cell labeling, corresponding to the receptor expression on each cell type and is expressed as Mean Fluorescence Intensity (MFI). Numbers above each peak correspond to percentage (%) of gated (M2) cells calculated using subjective gating. Fluorescence intensity (X-axis) is plotted as histograms on log scale (X-axis) using Flowjo 7.6.4 software (Tree Star Inc., Ashland OR). Y-axis depicts total events (cells) and expressed either as counts or % of maximal. P(AI-WAm/A549) = 0.0038; P(AI-WAm/RD) = 0.39; P(A549/RD) = 0.0018; P(A549/HEK293T) = 0.018; CAR P(AI-WAm/HEK293) = 0.0001; P(HEK293/RD) = 0.001; E. Comparison of hCAR expression in AI-WAm and control cells by IHC staining. CAR-specific (RmcB) primary antibody (same as used for FACS analysis, D) was used to stain AI-WAm cells. A549 and HEK293-T cells were used as positive and RD cells as negative controls for CAR expression. All cells were counter-stained for 5 min. with 300 nM DAPI to visualize nuclear DNA (blue). No primary antibody was used with control samples. Negative control (RD) cells show efficient nuclear staining but no discernible CAR staining (green), while A549 cells demonstrate a strong CAR-specific signal and AI-WAm cells display a moderate level of hCAR signal with diffuse pattern of cytosolic localization (white arrows) similar to that in A549 cells. In sharp contrast, CAR-overexpressing HEK293-T cells show a distinct localization of CAR protein in the cell membrane tight junctions (red arrows) with lesser cytosolic staining. Scale bars correspond to 100 µm.
Figure 3
Figure 3. Expression analyses of HSPG and integrin molecules as alternate receptors for fiber-modified Ads on AI-WAm cells.
Expression of αvβ3 and αvβ5 integrins (A and B) and heparin sulfate proteoglycans (C–E) in AI-WAm cell population and control cells was analyzed by flow cytometry (A, C, E) and IHC staining (B and D). Cells were incubated with primary anti-αvβ3 or anti-αvβ5 monoclonal antibodies for detection of corresponding integrin molecules or 10E4 antibody for detection of HSPG side chains (GAG) or anti-human syndecan 4 monoclonal antibody, followed by Alexa 488-conjugated secondary antibody. A and C, top charts: AI-WAm cells; middle charts: RD cells; bottom charts: A549 cells. For AI-WAm cells: P (αvβ3/αvβ5) = 0.75; P (Synd4/HSPG) = 0.29; For RD cells: P (Synd4/HSPG) = 0.67; for αvβ3: P(RD/A549) = 0.38; for αvβ5: P(AI-WAm/A549) = 0.23; for syndecan 4: P (RD/A549) = 0.2; for all other differences P<0.05; E. HSPG Ab (10E4) specificity control sample: A549 cells were treated with heparitinase (10 U/ml) for 1 hr at 37°C to remove GAG side chains. Green arrow shows shift of the fluorescence intensity peak resulting from reduction in cell labeling with 10E4 antibody (MFI decrease). Other details are as in Fig. 2D . B and D, scale bars correspond to: 100 µm in top image panels (integrins/AI-WAm, 10× objective), 10 µm (insert, 60× objective) and 50 µm (40× objective) in all other panels. Insert shows syndecan 4 staining image (60×) of A549 cells, clearly demonstrating a polarized intracellular localization of the protein.
Figure 4
Figure 4. Schematic representation of the Ad5 fiber proteins carrying intact and modified C-terminal knob domains.
Fiber modifications are indicated in the corresponding vector names: Ad5 (G/L) has unmodified fiber knob and possesses the native CAR tropism; Ad5-RGD contains a peptide ligand with an “RGD motif” in the HI loop (red loop) of the fiber knob; Ad5-pK7 contains a stretch of seven lysine residues (green oval) fused to the C-terminus of the Ad5 knob via a (GS)5 linker (green hook); Ad5-pK7/RGD incorporates both modifications in the corresponding locales of the same fiber molecule; Ad5/3 contains a chimera fiber with Ad5 fiber “knob” domain (gray) replaced with the Ad serotype 3 (Ad3) knob (blue), which retargets the vector to Ad3 receptor(s).
Figure 5
Figure 5. Augmentation of Ad5 gene transfer to AI-WAm cells by Ad5 vectors with various fiber modifications.
A. Representative fluorescent microscopy images of cells infected with the array of recombinant Ad5 vectors with genetically-modified fibers shown on Fig. 4. Relative gene transfer efficiencies in the AI-WAm and A549 cells were assessed by fluorescent microscopy of GFP-expressing cells transduced with the array of modified vectors 20 hrs post infection; (G/L) indicates the presence of two reporter genes (GFP and Luc) each under control of its own CMV promoter; (G) denotes a single-reporter GFP cassette. Infection with Ad5 (G/L) was performed at an MOI of 50 TCID50/cell, while doses of other vectors were adjusted by Luc expression to match that of Ad5 (G/L) in A549 cells (see Materials and Methods and Results). A 50 TCID50/cell infection dose was used for Ad5/3 (G) vector for normalization in A549 cells as it could not be adjusted by Luc expression like the other (G/L) vectors. Fluorescent images were captured with 10× objective and exposure time of 2 sec. for A549 cells and 400 msec. for AI-WAm cells. Each vector infection was carried out in triplicates. Shown are images of representative samples; B. Luc assay of lysates prepared from A549, RD and AI-WAm cell samples (same as shown in A) following vector dose normalization in A549 cells using 10 µl of each lysate (100 µl) for bioluminescence analysis. The data are presented as percentage (%) of the Ad5 (G/L) gene transfer efficiency (total RLU) in each cell type taken as 100%; RLU - relative Luc units, (L) - a single firefly Luc reporter expression cassette. Other details are as in Materials and Methods. C. The original Luc assay data of the AI-WAm samples (shown in A and B) presented as RLU per cell. Two different MOIs of Ad5 (G/L) infection were used for dose normalization: 10 and 50 TCID50/cell to illustrate dose dependence of the infectivity enhancement effects. All other details are as in B. D. Test for replication competent adenovirus (RCA) contamination in modified Ad vector preparations by qPCR analysis of Ad genomic DNA. AI-WAm cells were infected with A549-normalized vectors at the doses corresponding to MOI = 50 of the Ad5 (G/L) (C) and harvested 6, 20 and 36 hrs post infection for total DNA isolation. Viral genomes were quantified by qPCR and presented as E4 copy numbers normalized for total cellular DNA quantified by qPCR of the housekeeping (GAPDH) gene. No statistically significant increase in internalized genomic DNA evidences the lack of RCA-induced genomic DNA replication at 20 hours post infection (time point of Luc assay), suggesting that the reporter gene expression has not been affected for any vector. Color coding and other details are as in B and C. Stars above bars with the corresponding colors indicate changes relative to the 6 hr time point values with no statistical significance. P values (>0.05) are shown on the corresponding bars. Color brackets (with P values on the top) indicate value changes between 20 hr and 36 hr time points; black brackets (with P values on the top) show sample differences of no statistical significance (P>0.05) within the same time point. All other differences are statistically significant (P<0.05).
Figure 6
Figure 6. The infectivity enhancement effect of fiber-modified Ad5 vectors is mediated by αvβ3/αvβ5 integrins and/or HSPG molecules on AI-ameloblasts.
A. Differential blocking of gene transfer to AI-WAm cells by integrins. Ad5 RGD shows the highest sensitivity to integrin blocking, while transduction with Ad5-pK7/RGD (G/L) is only partially inhibited. Ad5-pK7 (G/L) gene transfer shows no statistically significant inhibition by integrins. B. Blocking of AI-WAm gene transfer by modified vectors with heparin. Heparin shows a profound dose-dependent blocking effect on transduction with pK7-modified Ads, as opposed to RGD-modified vector. Gray bars (with % values on the top) show percentage of the residual gene transfer level (RLU) resulting from blocking relative to that of unblocked controls (100%) shown by black bar for each fiber-modified vector. All bars represent mean values with standard deviations. All differences were statistically significant except where indicated by asterisk and P values (P>0.05) on the data bars.

References

    1. Simmer JP, Fincham AG. Molecular mechanisms of dental enamel formation. Crit Rev Oral Biol Med. 1995;6:84–108. - PubMed
    1. He P, Zhang Y, Kim SO, Radlanski RJ, Butcher K, et al. Ameloblast differentiation in the human developing tooth: effects of extracellular matrices. Matrix Biol. 2010;29(5):411–9. - PMC - PubMed
    1. Termine JD, Belcourt AB, Christner PJ, Conn KM, Nylen MU. Properties of dissociatively extracted fetal tooth matrix proteins. I. Principal molecular species in developing bovine enamel. J Biol Chem. 1980;255(20):9760–8. - PubMed
    1. Fukumoto S, Kiba T, Hall B, Iehara N, Nakamura T, et al. Ameloblastin is a cell adhesion molecule required for maintaining the differentiation state of ameloblasts. J Cell Biol. 2004;167(5):973–83. - PMC - PubMed
    1. Zalzal SF, Smith CE, Nanci A. Ameloblastin and amelogenin share a common secretory pathway and are co-secreted during enamel formation. Matrix Biol. 2008;27(4):352–9. - PubMed

Substances

LinkOut - more resources