Clinical Trial
. 2011;6(10):e24586.
doi: 10.1371/journal.pone.0024586. Epub 2011 Oct 7.

Adenovirus 5-vectored P. falciparum vaccine expressing CSP and AMA1. Part A: safety and immunogenicity in seronegative adults

Affiliations
Clinical Trial

Adenovirus 5-vectored P. falciparum vaccine expressing CSP and AMA1. Part A: safety and immunogenicity in seronegative adults

Martha Sedegah et al. PLoS One. 2011.

Abstract

Background: Models of immunity to malaria indicate the importance of CD8+ T cell responses for targeting intrahepatic stages and antibodies for targeting sporozoite and blood stages. We designed a multistage adenovirus 5 (Ad5)-vectored Plasmodium falciparum malaria vaccine, aiming to induce both types of responses in humans, that was tested for safety and immunogenicity in a Phase 1 dose escalation trial in Ad5-seronegative volunteers.

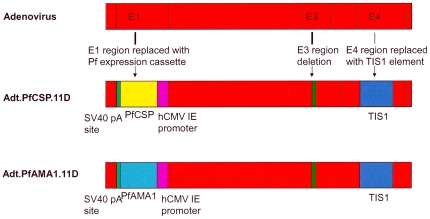
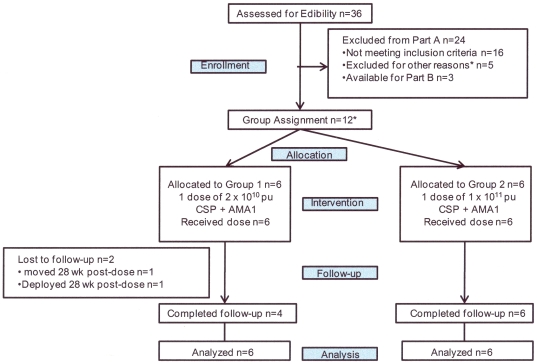
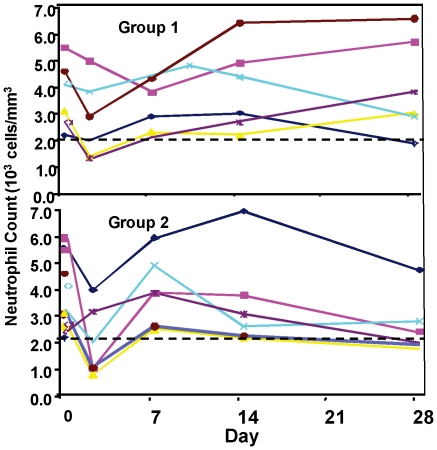
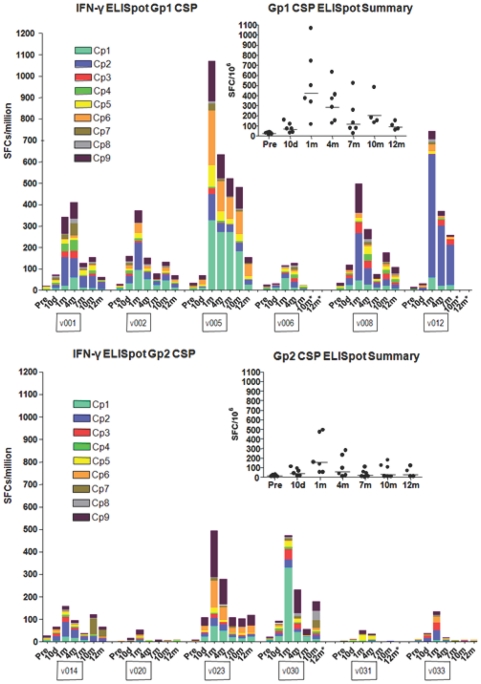
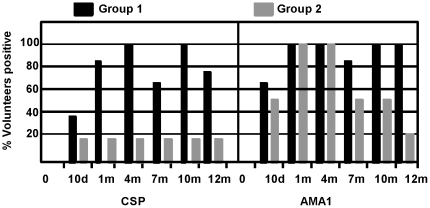
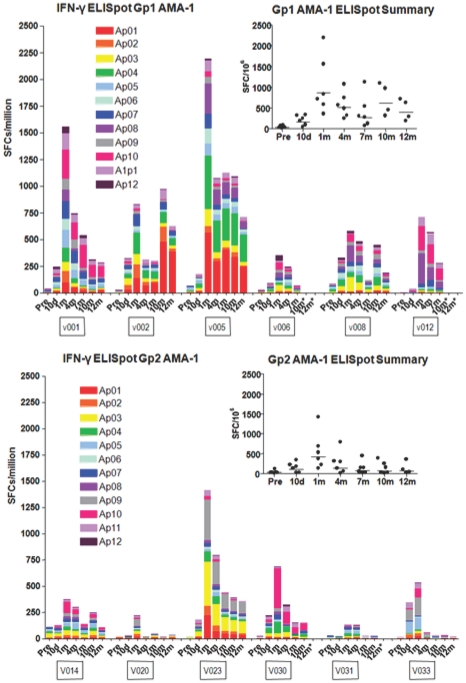
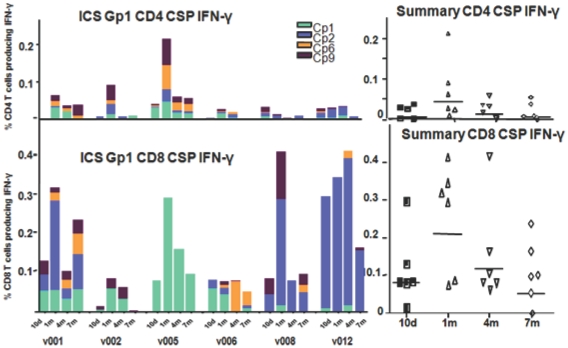
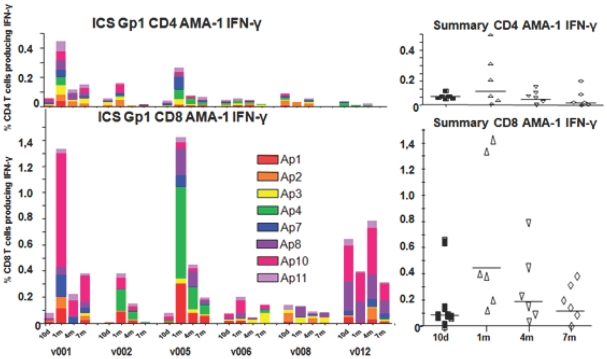
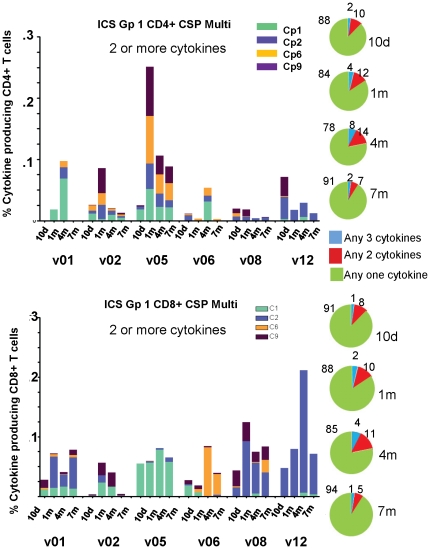
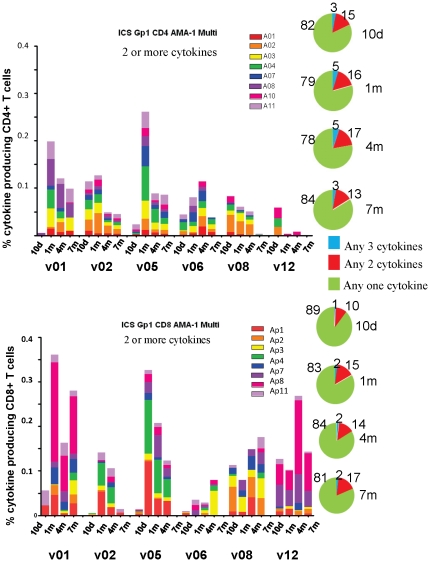
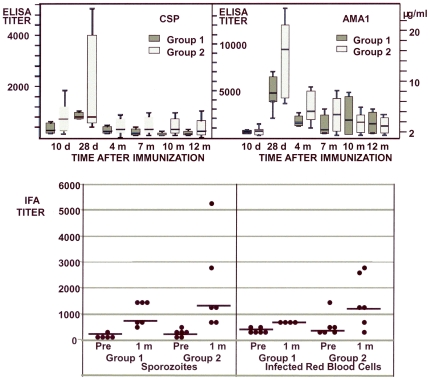
Methodology/principal findings: The NMRC-M3V-Ad-PfCA vaccine combines two adenovectors encoding circumsporozoite protein (CSP) and apical membrane antigen-1 (AMA1). Group 1 (n = 6) healthy volunteers received one intramuscular injection of 2×10∧10 particle units (1×10∧10 each construct) and Group 2 (n = 6) a five-fold higher dose. Transient, mild to moderate adverse events were more pronounced with the higher dose. ELISpot responses to CSP and AMA1 peaked at 1 month, were higher in the low dose (geomean CSP = 422, AMA1 = 862 spot forming cells/million) than in the high dose (CSP = 154, p = 0.049, AMA1 = 423, p = 0.045) group and were still positive at 12 months in a number of volunteers. ELISpot depletion assays identified dependence on CD4+ or on both CD4+ and CD8+ T cells, with few responses dependent only on CD8+ T cells. Intracellular cytokine staining detected stronger CD8+ than CD4+ T cell IFN-γ responses (CSP p = 0.0001, AMA1 p = 0.003), but similar frequencies of multifunctional CD4+ and CD8+ T cells secreting two or more of IFN-γ, TNF-α or IL-2. Median fluorescence intensities were 7-10 fold higher in triple than single secreting cells. Antibody responses were low but trended higher in the high dose group and did not inhibit growth of cultured P. falciparum blood stage parasites.

Significance: As found in other trials, adenovectored vaccines appeared safe and well-tolerated at doses up to 1×10∧11 particle units. This is the first demonstration in humans of a malaria vaccine eliciting strong CD8+ T cell IFN-γ responses.

Trial registration: ClinicalTrials.govNCT00392015.


Conflict of interest statement

Competing Interests: The authors have read the journal's policy and have the following conflicts: SM NOR CW worked for Clinical Research Management; JTB CRK worked for GenVec; DLD held a Pfizer Australia Senior Research Fellowship; JTB CRK DLD DC KL are inventors listed on U.S. Patent No., U.S. Patent No. 2009-0148477 A1, and international patent application PCT/US06/33982, titled “Adenoviral Vector-based Malaria Vaccines”; JTB CRK TLR KL DLD. are inventors listed on U.S. Patent Application 12/522,335, and international patent application PCT/US08/50565 titled “Adenoviral Vector-based Malaria Vaccines”. These do not alter the authors' adherence to all PLoS ONE policies on sharing data and materials.

Figures

Figure 1
Figure 1. Schematic of Ad5-PfCSP and Ad5-PfAMA1 vectors.
The parent adenovector was a serotype 5 adenovirus carrying deletions in E1, E4 and part of the E3 region with a transcriptionally inert spacer inserted into the site of the E4 deletion (TIS1), the resulting replication defective vector called GV11D. Codon-optimized CSP or AMA1 genes were inserted into the E1 region under the control of a cytomegalovirus promoter (hCMV IE). SV40 pA = simian virus 40 polyadenylation sequence.
Figure 2
Figure 2. Flow diagram of volunteers in Groups 1 and 2.
The first six volunteers were allocated to Group 1 and the subsequent six volunteers to Group 2. *Reasons for exclusion: lost to follow up (2), moved out of area (1), deployed (1), job commitments (1).
Figure 3
Figure 3. Neutrophil kinetics in Groups 1 and 2 after immunization.
A fall in neutrophil count was observed in most volunteers at 2–3 days post-immunization with return to normal or near normal levels by day 7 post-immunization.
Figure 4
Figure 4. ELISpot activity of serial bleeds of volunteers in Group 1 and Group 2 with CSP peptide pools.
The ELISpot activities of each volunteer at pre-immunization, 10 d and 1, 4, 7, 10 and 11–12 m are displayed using color-coded CSP peptide pools Cp1–Cp9. The inserts show the values of the sum of each volunteer's responses at each time point and the bar indicates the geometric mean of the group. At 1 month, geomean values were higher (422 sfc/m PBMC's) in the low dose Group 1 than the high dose Group 2 (154 sfc/m PBMC's).
Figure 5
Figure 5. Percent of Group 1 and Group 2 volunteers who responded to one or more CSP or AMA1 peptide pools at each time point after immunization.
ELISpot activity was determined to be positive or negative for a given peptide pool as described in Methods. A positive volunteer is one who recognized one or more peptide pools at each of the time points 10 d and 1, 4, 7, 10 and 11–12 m after immunization. The percent positive responders are displayed at each time point for CSP or AMA1.
Figure 6
Figure 6. ELISpot activity of serial bleeds of volunteers in Group 1 and Group 2 with AMA1 peptide pools.
The ELISpot activities of each volunteer at pre-immunization, 10 d and 1, 4, 7, 10 and 11–12 m are displayed using color-coded AMA1 peptide pools Ap1–Ap12. The inserts show the values of the sum of each volunteer's responses at each time point and the bar indicates the geometric mean of the group. At 1 month, geomean values were higher (862 sfc/m PBMC's) in the low dose Group 1 than the high dose Group 2 (422 sfc/m PBMC's).
Figure 7
Figure 7. T-ICS CD4+ and CD8+ IFN-γ activity of serial bleeds of volunteers in Group 1 with CSP peptide pools.
Four Cp peptide pools that were most strongly recognized in ELISpot assays were used to determine ICS CD4+ and CD8+ IFN-γ activity. The ICS CD4+ and CD8+ T cell activities of each volunteer at 10 d and 1, 4, and 7 m (subtracting pre-immunization values) are displayed using color-coded CSP peptide pools. Scales for each phenotype have been equalized to emphasize the lower CD4+ responses. The inserts show the values of the sum of each volunteer's responses at each time point and the bar indicates the geometric mean of the group. At 1 month CD8+ responses (geomean 0.21% CD8+ T cells, std dev 0.14) were higher than CD4+ responses (geomean 0.044% CD4+ T cells, std dev 0.075).
Figure 8
Figure 8. T-ICS CD4+ and CD8+ IFNactivity of serial bleeds of each volunteer in Group 1 with AMA1 peptide pools.
Eight Ap peptide pools that were most strongly recognized in ELISpot assays were used to determine ICS CD4+ and CD8+ IFN-γ activity. The ICS CD4+ and CD8+ T cell activities of each volunteer at 10 days and 1, 4, and 7 months (subtracting pre-immunization values) are displayed using color-coded AMA1 peptide pools. Scales for each phenotype have been equalized to emphasize the lower CD4+ responses. The inserts show the values of the sum of each volunteer's responses at each time point and the bar indicates the geometric mean of the group. At 1 month, CD8+ responses (geomean 0.44% CD8+ T cells, std dev 0.58) were higher than CD4+ T-INF-γ responses (geomean 0.086% CD4+ T cells, std dev 0.17).
Figure 9
Figure 9. Multifunctional CD4+ and CD8+ T cells of serial bleeds of volunteers in Group 1 with CSP peptide pools.
A and C: Multifunctional (any two cytokines) CD4+ and CD8+ T cell activities of each volunteer at 10 d, 1, 4, and 7 m after immunization (subtracting pre-immunization values) are displayed using color-coded CSP peptide pools. At 1 month, CD4+ multi responses (geomean 0.027% CD4+ T cells, std dev 953) and CD8+ multi responses (geomean 0.06% CD8+ T cells, std dev 346) were similar. B and D: Pie charts representing the proportion of the cytokine response indicated by cytokine subsets as shown; numbers on pie charts represent percent of that subset of the total cells.
Figure 10
Figure 10. Multifunctional CD4+ and CD8+ T cells of serial bleeds of volunteers in Group 1 with AMA1 peptide pools.
A and C: Multifunctional (any two cytokines) CD4+ and CD8+ T cell activities of each volunteer at 10 d, 1, 4, and 7 m after immunization (subtracting pre-immunization values) are displayed using color-coded AMA1 peptide pools. At 1 month, CD4+ multi responses (geomean 0.072% CD4+ T cells, std dev 94) and CD8+ multi responses (geomean 0.13% CD8+ T cells, std dev 14) were similar. B and D: Pie charts representing the proportion of the cytokine response indicated by cytokine subsets as shown; numbers on pie charts represent per cent of that subset of the total cells.
Figure 11
Figure 11. Group 1 and Group 2 anti-CSP and AMA1 antibody responses by ELISA and IFA.
A and B: Box plots of the means and 25% and 75% percentiles of each group at 10 d and 1, 4, 7, 10 and 11–12 m after immunization. The first and third quartiles are the top and base of each box, and the upper and lower bars represent the high and low values respectively. C: IFA titers of each group pre-immunization and at 1 month post-immunization against sporozoites (left panel) and infected red blood cells (right panel). Bars represent geomeans.

Similar articles

Cited by

References

    1. Clyde DF. Immunization of man against falciparum and vivax malaria by use of attenuated sporozoites. Am J Trop Med Hyg. 1975;24:397–401. - PubMed
    1. Sigler CI, Leland P, Hollingdale MR. In vitro infectivity of irradiated Plasmodium berghei sporozoites to cultured hepatoma cells. Am J Trop Med Hyg. 1984;33:544–547. - PubMed
    1. Nussenzweig RS, Vanderberg J, Most H, Orton C. Protective immunity produced by the injection of x-irradiated sporozoites of plasmodium berghei. Nature. 1967;216:160–162. - PubMed
    1. Oliveira GA, Kumar KA, Calvo-Calle JM, Othoro C, Altszuler D, et al. Class II-restricted protective immunity induced by malaria sporozoites. Infect Immun. 2008;76:1200–1206. - PMC - PubMed
    1. Doolan DL, Martinez-Alier N. Immune response to pre-erythrocytic stages of malaria parasites. Curr Mol Med. 2006;6:169–185. - PubMed

Publication types

MeSH terms

Associated data