Clinical Trial
. 2011;6(10):e25868.
doi: 10.1371/journal.pone.0025868. Epub 2011 Oct 7.

Adenovirus-5-vectored P. falciparum vaccine expressing CSP and AMA1. Part B: safety, immunogenicity and protective efficacy of the CSP component

Affiliations
Clinical Trial

Adenovirus-5-vectored P. falciparum vaccine expressing CSP and AMA1. Part B: safety, immunogenicity and protective efficacy of the CSP component

Cindy Tamminga et al. PLoS One. 2011.

Abstract

Background: A protective malaria vaccine will likely need to elicit both cell-mediated and antibody responses. As adenovirus vaccine vectors induce both these responses in humans, a Phase 1/2a clinical trial was conducted to evaluate the efficacy of an adenovirus serotype 5-vectored malaria vaccine against sporozoite challenge.

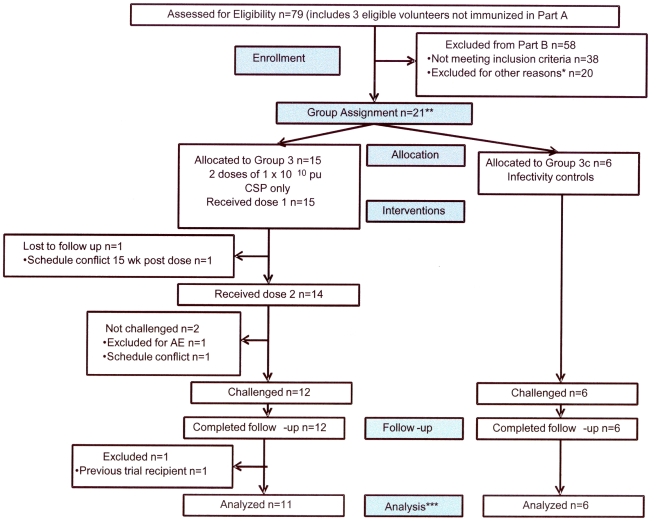
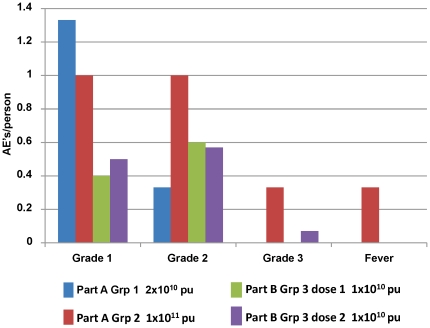
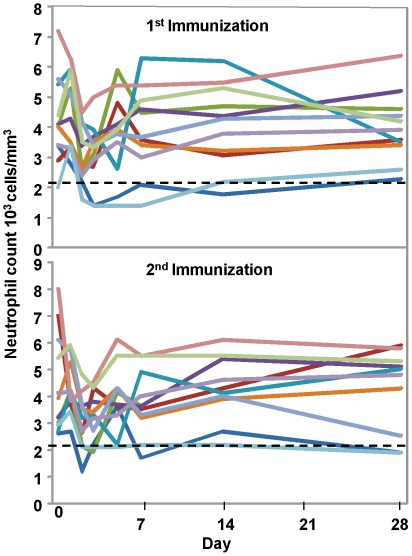
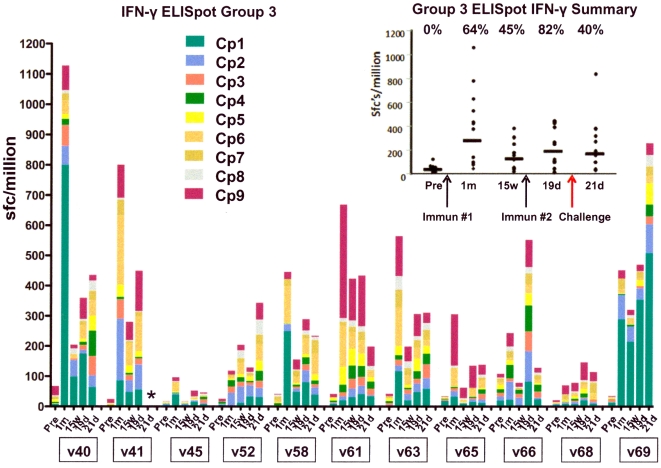
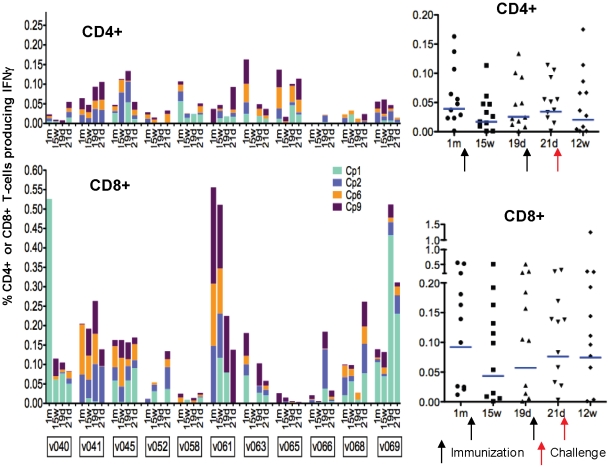
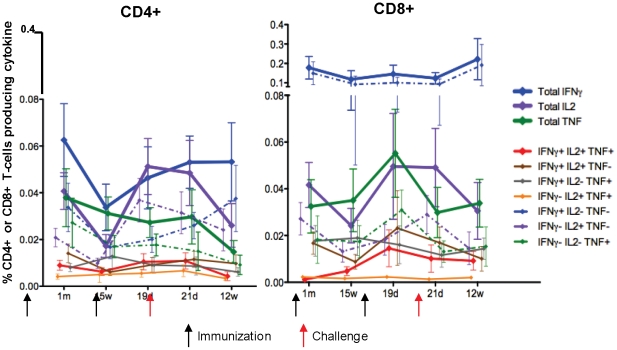
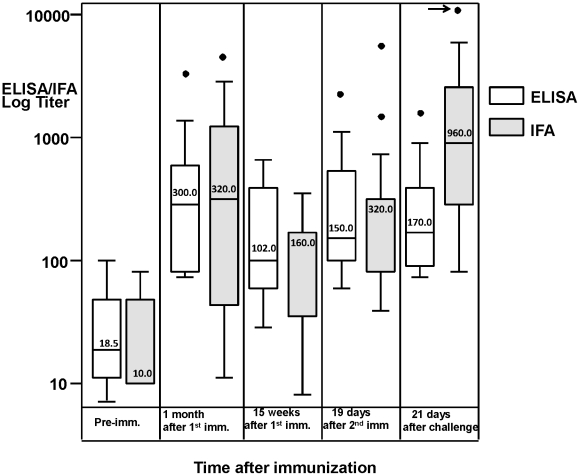
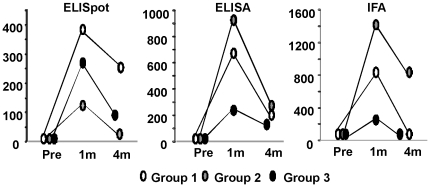
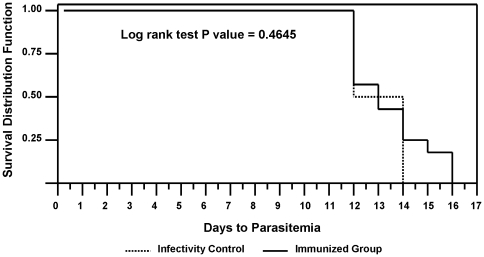
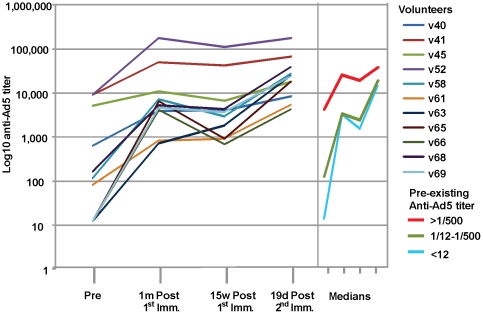
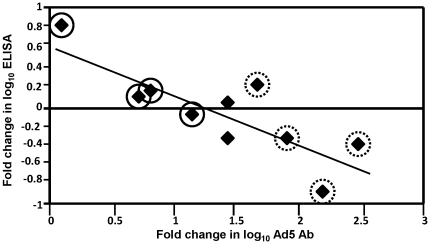
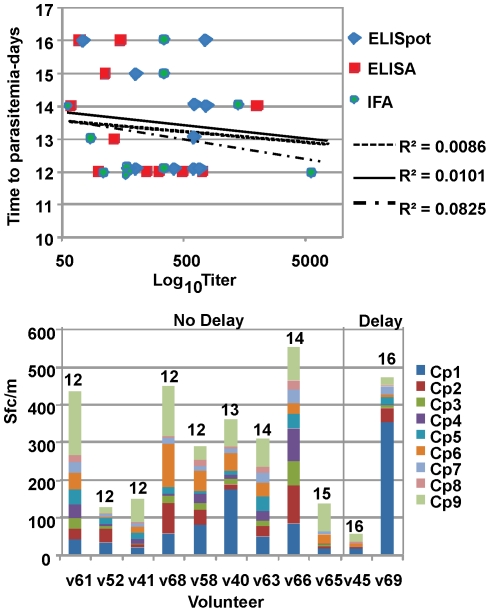
Methodology/principal findings: NMRC-MV-Ad-PfC is an adenovirus vector encoding the Plasmodium falciparum 3D7 circumsporozoite protein (CSP). It is one component of a two-component vaccine NMRC-M3V-Ad-PfCA consisting of one adenovector encoding CSP and one encoding apical membrane antigen-1 (AMA1) that was evaluated for safety and immunogenicity in an earlier study (see companion paper, Sedegah et al). Fourteen Ad5 seropositive or negative adults received two doses of NMRC-MV-Ad-PfC sixteen weeks apart, at 1 x 10¹⁰ particle units per dose. The vaccine was safe and well tolerated. All volunteers developed positive ELISpot responses by 28 days after the first immunization (geometric mean 272 spot forming cells/million[sfc/m]) that declined during the following 16 weeks and increased after the second dose to levels that in most cases were less than the initial peak (geometric mean 119 sfc/m). CD8+ predominated over CD4+ responses, as in the first clinical trial. Antibody responses were poor and like ELISpot responses increased after the second immunization but did not exceed the initial peak. Pre-existing neutralizing antibodies (NAb) to Ad5 did not affect the immunogenicity of the first dose, but the fold increase in NAb induced by the first dose was significantly associated with poorer antibody responses after the second dose, while ELISpot responses remained unaffected. When challenged by the bite of P. falciparum-infected mosquitoes, two of 11 volunteers showed a delay in the time to patency compared to infectivity controls, but no volunteers were sterilely protected.

Significance: The NMRC-MV-Ad-PfC vaccine expressing CSP was safe and well tolerated given as two doses, but did not provide sterile protection.

Trial registration: ClinicalTrials.gov NCT00392015.


Conflict of interest statement

Competing Interests: SM, NOR, CW, and SD are employees of Clinical Research Management and JTB and CRK are employees of GenVec, Inc. JB, CRK, DLD, DC, and KL are inventors listed on U.S. Patent No., U.S. Patent No. 2009-0148477 A1, and international patent application PCT/ US06/33982, titled “Adenoviral Vector-based Malaria Vaccines”; JB, CRK, TLR, KL, and DLD are inventors listed on U.S. Patent Application 12/522,335, and international patent application PCT/US08/50565 titled “Adenoviral Vector-based Malaria Vaccines”. SM NON CW and SD were employed by Clinical Research Management Inc., and JTB and CRK were employed by Genvec Inc. These do not alter the authors' adherence to all PLoS ONE policies on sharing data and materials.

Figures

Figure 1
Figure 1. Flow diagram of volunteers (Group 3).
* Reasons for exclusion: Moved out of area (3), deployed (2), lost to follow up (2), opted out (1), eligible but preferred waiting for follow-on study (12). ** The first 15 volunteers were allocated to the vaccine group and the final six volunteers to infectivity controls. *** 11 volunteers analyzed for immunogenicity and protection; 15 analyzed for safety of dose 1, 14 for safety of dose 2.
Figure 2
Figure 2. Frequency of Selected Adverse Events Recorded from Day of Immunization through 14 days post-immunization for Groups 1, 2 and 3.
The frequencies of pain, malaise, headache and myalgia (combined) by severity grade, and, separately, of objective fever (one grade 1 and one grade 2) are shown for each vaccine group.
Figure 3
Figure 3. Neutrophil Kinetics Group 3.
A fall in neutrophil count was observed in most volunteers at 2–3 days post-immunization with return to normal or near normal levels by day 7 post-immunization after the 1st and 2nd immunization. Day 0 for the 2nd immunization is 15 weeks after the 1st immunization. Dotted line indicates normal levels.
Figure 4
Figure 4. ELISpot IFN-γ CSP.
The ELISpot activity of each volunteer at pre-immunization, 1 month and 15 weeks after the first immunization, 19 days after the second immunization, and 21 days after challenge (* this last data point not available for volunteer 41), as stacked, color-coded peptide pool-specific responses at each time point. The insert shows the values of the sum of pool-specific responses for each volunteer at each time point. The horizontal bar indicates the geometric mean of the group, the arrows indicate the first and second immunizations and challenge, and the percent of volunteers who were positive with at least one CSP pool at each time point is written at the top of the insert.
Figure 5
Figure 5. ICS CD4+ and CD8+ T cell IFN-γ CSP responses.
Percent CD4+ and CD8+ T cells secreting IFN-γ in response to CSP for each volunteer at each time point, color-coded by peptide pool. The percents at each time point are plotted for each volunteer along with the geometric means for the group (horizontal bars). Responses prior to immunization are subtracted from all data in order to show only vaccine-induced responses.
Figure 6
Figure 6. ICS CD4+ and CD8+ T cell multifunctional CSP responses.
Arithmetic group mean percents with standard error of the mean for all cytokine phenotypes (total IFN-γ, total IL-2 or total TNF-α in bold solid lines, only IFN-γ, only IL2 or only TNF-α in dotted lines, and other subsets as non-bold solid lines). Responses prior to immunization are subtracted from all data in order to show only vaccine-induced responses.
Figure 7
Figure 7. CSP ELISA and Sporozoite IFA activity.
Box plots of the medians (50th percentile) and 25th and 75th percentiles of ELISA and IFA activities prior to immunization, at 1 month and 15 weeks after the first immunization, 19 days after the second immunization, and 21 days after challenge. Whiskers spanning the first and third quartiles are at the base and top of each box, respectively, while the upper and lower horizontal bars at the ends of the whiskers represent the maximum and minimum values, respectively. Outliers are depicted by black dots; the arrow points to an outlier above the scale of the chart (1/20,480). The numbers give the value of the medians of each box, which in some cases are the same as the 25th or 75th percentile. When pre-challenge and post challenge titers were compared, ELISA remained similar (p = 0.15) but titers significantly increased for IFA (p = 0.02) using repeated analysis of log transformed values.
Figure 8
Figure 8. Comparing Groups 1, 2 and 3 for Immune Outcome Measures.
The geometric means of ELISpot assay (CSP), ELISA (CSP) and IFA (sporozoite) in Groups 1, 2 and 3 are shown pre-immunization (Pre) and 1 and 4 months post immunization (1 month and 15 weeks post first immunization for Group 3). Groups 1 and 3 had better ELISpot responses than Group 2 (high dose), while Group 2 had the better ELISA and IFA responses (see Sedegah et al). Combination of the vector encoding CSP with the vector encoding AMA1 (Group 1) may have improved responses to CSP relative to the vector encoding CSP administered alone (Group 3), as immune responses were higher in Group 1 than in Group 3 for the three immune measures.
Figure 9
Figure 9. Vaccine Efficacy by Kaplan-Meier Plot.
Two immunized volunteers became parasitemic on day 16, more than 2 standard deviations beyond the geometric mean time for the infectivity controls (day 13), indicating a significant delay. When days to patency were compared between the immunized and control groups, there was no difference observed (p = 0.46).
Figure 10
Figure 10. Anti-Ad5 NAb titers.
Anti-Ad5 neutralization titers were measured pre-immunization (Pre) and 1 month and 15 weeks post 1st immunization and 19 days post 2nd immunization. Volunteers are shown in color-coded lines. Right Panel: median NAb titers of volunteers with high (>500), low (12–500) or absent (<12) titers at the time of enrolment.
Figure 11
Figure 11. Negative Correlation between Fold Increase in Ad5 NAb Titer and Fold Change in CSP ELISA Titer.
The ratio between Ad5 NAb titers induced by the first immunization (measured at 1 month) and titers prior to the first immunization (fold increase) was negatively correlated with the ratio between CSP ELISA titers induced by the second immunization (at 19 days) and titers induced by the first (at 1 month) (fold change). Volunteers with absent pre-existing immunity prior to the first immunization (titer <12, dotted circles) showed the greatest fold increase in NAb and, overall, the poorest boosting of antibody responses to CSP, while the volunteers with the highest pre-existing immunity (titer >500) (solid circles) showed the least fold increases in NAb and, overall, better boosting of antibody responses.
Figure 12
Figure 12. Relationship between pre-challenge ELISA (CSP), IFA (sporozoite) and ELISpot (CSP) activities and time to patency after challenge.
Upper Panel: The time to patency in days after sporozoite challenge was compared to the pre-challenge magnitude of three immune measures: ELISA (CSP), IFA (sporozoite) and ELISpot (CSP). Best-fit trendlines are plotted with r2 values shown. There was no correlation between immune measures and time to patency. Lower Panel: Volunteers are arrayed according to time to patency (labeled in days at the top of each column), showing ELISpot activity to each color-coded CSP peptide pool. There is no evident relationship between magnitude of pool-specific or summed responses and time to patency.

Similar articles

Cited by

References

    1. WHO World Malaria Report. 2009. http://wwwwhoint/malaria/world_malaria_report_2009/en/indexhtml.
    1. Noedl H, Se Y, Schaecher K, Smith BL, Socheat D, et al. Evidence of artemisinin-resistant malaria in western Cambodia. N Engl J Med. 2008;359:2619–2620. - PubMed
    1. Sigler CI, Leland P, Hollingdale MR. In vitro infectivity of irradiated Plasmodium berghei sporozoites to cultured hepatoma cells. Am J Trop Med Hyg. 1984;33:544–547. - PubMed
    1. Nussenzweig RS, Vanderberg J, Most H, Orton C. Protective immunity produced by the injection of x-irradiated sporozoites of plasmodium berghei. Nature. 1967;216:160–162. - PubMed
    1. Hoffman SL, Goh LM, Luke TC, Schneider I, Le TP, et al. Protection of humans against malaria by immunization with radiation-attenuated Plasmodium falciparum sporozoites. J Infect Dis. 2002;185:1155–1164. - PubMed

Publication types

MeSH terms

Associated data