

Adaptive multi-cluster fuzzy C-means segmentation of breast parenchymal tissue in digital mammography
- PMID: 22003744
- PMCID: PMC5510350
- DOI: 10.1007/978-3-642-23626-6_69
Adaptive multi-cluster fuzzy C-means segmentation of breast parenchymal tissue in digital mammography
Abstract
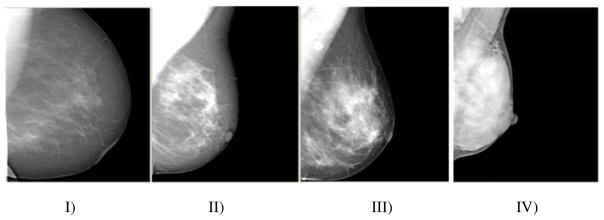
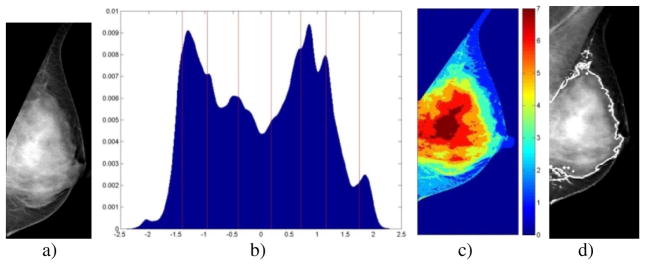
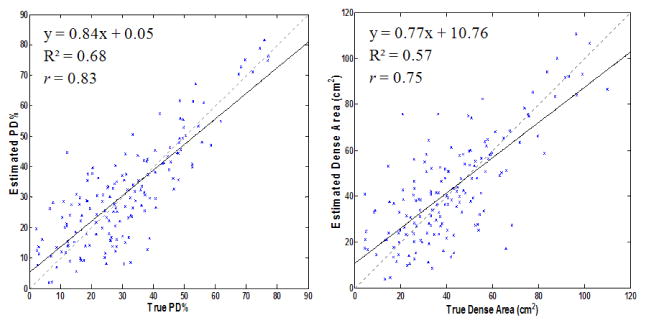
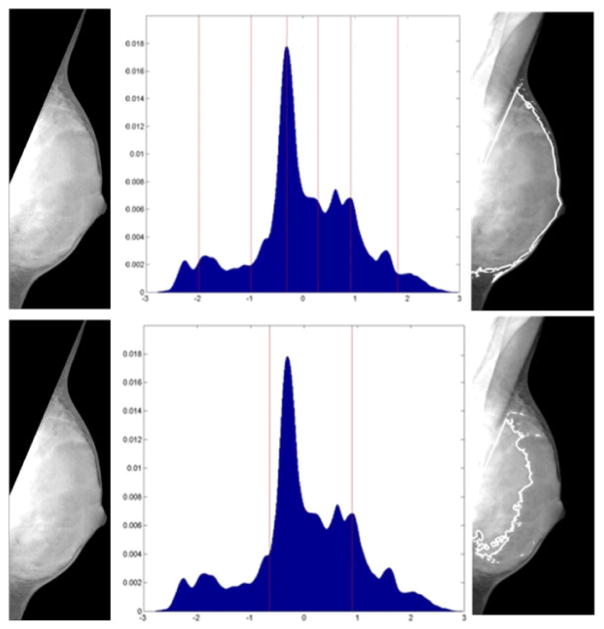
The relative fibroglandular tissue content in the breast, commonly referred to as breast density, has been shown to be the most significant risk factor for breast cancer after age. Currently, the most common approaches to quantify density are based on either semi-automated methods or visual assessment, both of which are highly subjective. This work presents a novel multi-class fuzzy c-means (FCM) algorithm for fully-automated identification and quantification of breast density, optimized for the imaging characteristics of digital mammography. The proposed algorithm involves adaptive FCM clustering based on an optimal number of clusters derived by the tissue properties of the specific mammogram, followed by generation of a final segmentation through cluster agglomeration using linear discriminant analysis. When evaluated on 80 bilateral screening digital mammograms, a strong correlation was observed between algorithm-estimated PD% and radiological ground-truth of r=0.83 (p<0.001) and an average Jaccard spatial similarity coefficient of 0.62. These results show promise for the clinical application of the algorithm in quantifying breast density in a repeatable manner.
Figures
Similar articles
-
Estimation of breast percent density in raw and processed full field digital mammography images via adaptive fuzzy c-means clustering and support vector machine segmentation.Med Phys. 2012 Aug;39(8):4903-17. doi: 10.1118/1.4736530. Med Phys. 2012. PMID: 22894417 Free PMC article.
-
Automated fibroglandular tissue segmentation and volumetric density estimation in breast MRI using an atlas-aided fuzzy C-means method.Med Phys. 2013 Dec;40(12):122302. doi: 10.1118/1.4829496. Med Phys. 2013. PMID: 24320533 Free PMC article.
-
An Efficient Segmentation and Classification System in Medical Images Using Intuitionist Possibilistic Fuzzy C-Mean Clustering and Fuzzy SVM Algorithm.Sensors (Basel). 2020 Jul 13;20(14):3903. doi: 10.3390/s20143903. Sensors (Basel). 2020. PMID: 32668793 Free PMC article.
-
Development of a quantitative method for analysis of breast density based on three-dimensional breast MRI.Med Phys. 2008 Dec;35(12):5253-62. doi: 10.1118/1.3002306. Med Phys. 2008. PMID: 19175084 Free PMC article.
-
Fuzzy C-Means Clustering: A Review of Applications in Breast Cancer Detection.Entropy (Basel). 2023 Jul 4;25(7):1021. doi: 10.3390/e25071021. Entropy (Basel). 2023. PMID: 37509968 Free PMC article. Review.
Cited by
-
Breast Cancer Detection using Crow Search Optimization based Intuitionistic Fuzzy Clustering with Neighborhood Attraction.Asian Pac J Cancer Prev. 2019 Jan 25;20(1):157-165. doi: 10.31557/APJCP.2019.20.1.157. Asian Pac J Cancer Prev. 2019. PMID: 30678427 Free PMC article.
-
Mammographic parenchymal patterns as an imaging marker of endogenous hormonal exposure: a preliminary study in a high-risk population.Acad Radiol. 2013 May;20(5):635-46. doi: 10.1016/j.acra.2012.12.016. Acad Radiol. 2013. PMID: 23570938 Free PMC article.
-
AutoDensity: an automated method to measure mammographic breast density that predicts breast cancer risk and screening outcomes.Breast Cancer Res. 2013;15(5):R80. doi: 10.1186/bcr3474. Breast Cancer Res. 2013. PMID: 24020331 Free PMC article.
-
A Review on Automatic Mammographic Density and Parenchymal Segmentation.Int J Breast Cancer. 2015;2015:276217. doi: 10.1155/2015/276217. Epub 2015 Jun 11. Int J Breast Cancer. 2015. PMID: 26171249 Free PMC article. Review.
-
Automatic and fast segmentation of breast region-of-interest (ROI) and density in MRIs.Heliyon. 2018 Dec 17;4(12):e01042. doi: 10.1016/j.heliyon.2018.e01042. eCollection 2018 Dec. Heliyon. 2018. PMID: 30582055 Free PMC article.
References
-
- Wolfe JN. Breast patterns as an index of risk for developing breast cancer. Am J Roentgenol. 1976;126:1130–1137. - PubMed
-
- Tice TA, Kerlikowske K. Screening and prevention of breast cancer in primary care. Prim Care. 2009;36:533–558. - PubMed
-
- D’Orsi CJ, Bassett LW, Berg WA, Feig SA, Jackson VP, Kopans DB. Reston Am Col of Rad. 4. 2003. Breast imaging reporting and data system: ACR BIRADS-mammography.
-
- Martin KE, Helvie MA, Zhou C, Roubidoux MA, Bailey JE, Paramagul C, Blane CE, Klein KA, Sonnad SS, Chan HP. Mammographic density measured with quantitative computeraided method: comparison with radiologists’ estimates and BIRADS categories. Radiology. 2006;240:656–665. - PubMed
-
- Nicholson BT, LoRusso AP, Smolkin M, Bovbjerg VE, Petroni GR, Harvey JA. Accuracy of assigned BIRADS breast density category definitions. Acad Radiol. 2006;13:1143–1149. - PubMed
Publication types
MeSH terms
Substances
Grants and funding
LinkOut - more resources
Full Text Sources
Other Literature Sources
Medical