

Allosteric activation of cytochrome P450 3A4 by α-naphthoflavone: branch point regulation revealed by isotope dilution analysis
- PMID: 22004098
- PMCID: PMC3226823
- DOI: 10.1021/bi2013454
Allosteric activation of cytochrome P450 3A4 by α-naphthoflavone: branch point regulation revealed by isotope dilution analysis
Abstract
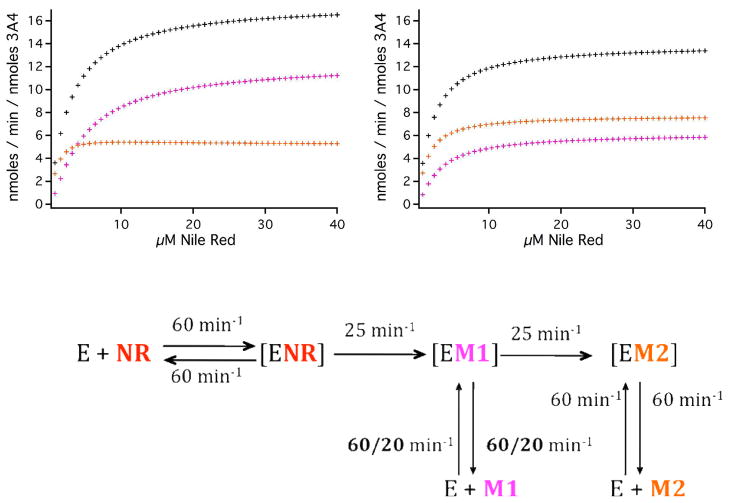
Cytochrome P450 3A4 (CYP3A4) is the dominant xenobiotic metabolizing CYP. Despite great interest in CYP enzymology, two in vitro aspects of CYP3A4 catalysis are still not well understood, namely, sequential metabolism and allosteric activation. We have therefore investigated such a system in which both phenomena are present. Here we report that the sequential metabolism of Nile Red (NR) is accelerated by the heterotropic allosteric effector α-naphthoflavone (ANF). ANF increases the rates of formation for NR metabolites M1 and M2 and also perturbs the metabolite ratio in favor of M2. Thus, ANF has as an allosteric effect on a kinetic branch point. Co-incubating deuterium-labeled NR and unlabeled M1, we show that ANF increases k(cat)/k(off) ~1.8-fold in favor of the k(cat) of M2 production. Steady-state metabolic experiments are analyzed using a kinetic model in which the enzyme and substrates are not in rapid equilibrium, and this distinction allows for the estimation of rates of catalysis for the formation of both the primary (M1) and secondary (M2) products, as well as the partitioning of enzyme between these states. These results are compared with those of earlier spectroscopic investigations of NR and ANF cooperativity, and a mechanism of ANF heteroactivation is presented that involves effects on substrate off rate and coupling efficiency.
© 2011 American Chemical Society
Figures


Similar articles
-
Analysis of heterotropic cooperativity in cytochrome P450 3A4 using alpha-naphthoflavone and testosterone.J Biol Chem. 2011 Feb 18;286(7):5540-5. doi: 10.1074/jbc.M110.182055. Epub 2010 Dec 22. J Biol Chem. 2011. PMID: 21177853 Free PMC article.
-
Allosteric effects on substrate dissociation from cytochrome P450 3A4 in nanodiscs observed by ensemble and single-molecule fluorescence spectroscopy.J Am Chem Soc. 2008 Nov 26;130(47):15746-7. doi: 10.1021/ja805772r. J Am Chem Soc. 2008. PMID: 18980315 Free PMC article.
-
Energetics of heterotropic cooperativity between alpha-naphthoflavone and testosterone binding to CYP3A4.Arch Biochem Biophys. 2007 Jul 1;463(1):89-101. doi: 10.1016/j.abb.2007.03.006. Epub 2007 Apr 2. Arch Biochem Biophys. 2007. PMID: 17459328 Free PMC article.
-
Heterotropic cooperativity of cytochrome P450 3A4 and potential drug-drug interactions.Curr Drug Metab. 2001 Jun;2(2):185-98. doi: 10.2174/1389200013338658. Curr Drug Metab. 2001. PMID: 11469725 Review.
-
Challenges in assignment of allosteric effects in cytochrome P450-catalyzed substrate oxidations to structural dynamics in the hemoprotein architecture.J Inorg Biochem. 2017 Feb;167:100-115. doi: 10.1016/j.jinorgbio.2016.11.025. Epub 2016 Nov 25. J Inorg Biochem. 2017. PMID: 27919007 Review.
Cited by
-
Mechanism of drug-drug interactions mediated by human cytochrome P450 CYP3A4 monomer.Biochemistry. 2015 Apr 7;54(13):2227-39. doi: 10.1021/acs.biochem.5b00079. Epub 2015 Mar 25. Biochemistry. 2015. PMID: 25777547 Free PMC article.
-
Conformational selection is present in ligand binding to cytochrome P450 19A1 lipoprotein nanodiscs.J Inorg Biochem. 2020 Aug;209:111120. doi: 10.1016/j.jinorgbio.2020.111120. Epub 2020 May 21. J Inorg Biochem. 2020. PMID: 32464592 Free PMC article.
-
Direct protein-protein interactions and substrate channeling between cellular retinoic acid binding proteins and CYP26B1.FEBS Lett. 2016 Aug;590(16):2527-35. doi: 10.1002/1873-3468.12303. Epub 2016 Jul 28. FEBS Lett. 2016. PMID: 27416800 Free PMC article.
-
Nanodisc-embedded cytochrome P450 P3A4 binds diverse ligands by distributing conformational dynamics to its flexible elements.J Inorg Biochem. 2023 Jul;244:112211. doi: 10.1016/j.jinorgbio.2023.112211. Epub 2023 Apr 5. J Inorg Biochem. 2023. PMID: 37080138 Free PMC article.
-
Optimization of the bacterial cytochrome P450 BM3 system for the production of human drug metabolites.Int J Mol Sci. 2012 Nov 28;13(12):15901-24. doi: 10.3390/ijms131215901. Int J Mol Sci. 2012. PMID: 23443101 Free PMC article. Review.
References
-
- Guengerich FP. Cytochrome P450 and chemical toxicology. Chem Res Toxicol. 2008;21:70–83. - PubMed
-
- Atkins WM. Non-Michaelis-Menten kinetics in cytochrome P450-catalyzed reactions. Annu Rev Pharmacol Toxicol. 2005;45:291–310. - PubMed
-
- Schwab GE, Raucy JL, Johnson EF. Modulation of rabbit and human hepatic cytochrome P-450-catalyzed steroid hydroxylations by alpha-naphthoflavone. Mol Pharmacol. 1988;33:493–499. - PubMed
-
- Shou M, Grogan J, Mancewicz JA, Krausz KW, Gonzalez FJ, Gelboin HV, Korzekwa KR. Activation of CYP3A4: evidence for the simultaneous binding of two substrates in a cytochrome p450 active site. Biochemistry. 1994;33:6450–6455. - PubMed
Publication types
MeSH terms
Substances
Grants and funding
LinkOut - more resources
Full Text Sources
Miscellaneous
