. 2011 Dec;37(6):1939-56.
doi: 10.1037/a0025641. Epub 2011 Oct 17.

Word recognition reflects dimension-based statistical learning

Affiliations

Word recognition reflects dimension-based statistical learning

Kaori Idemaru et al. J Exp Psychol Hum Percept Perform. 2011 Dec.

Abstract

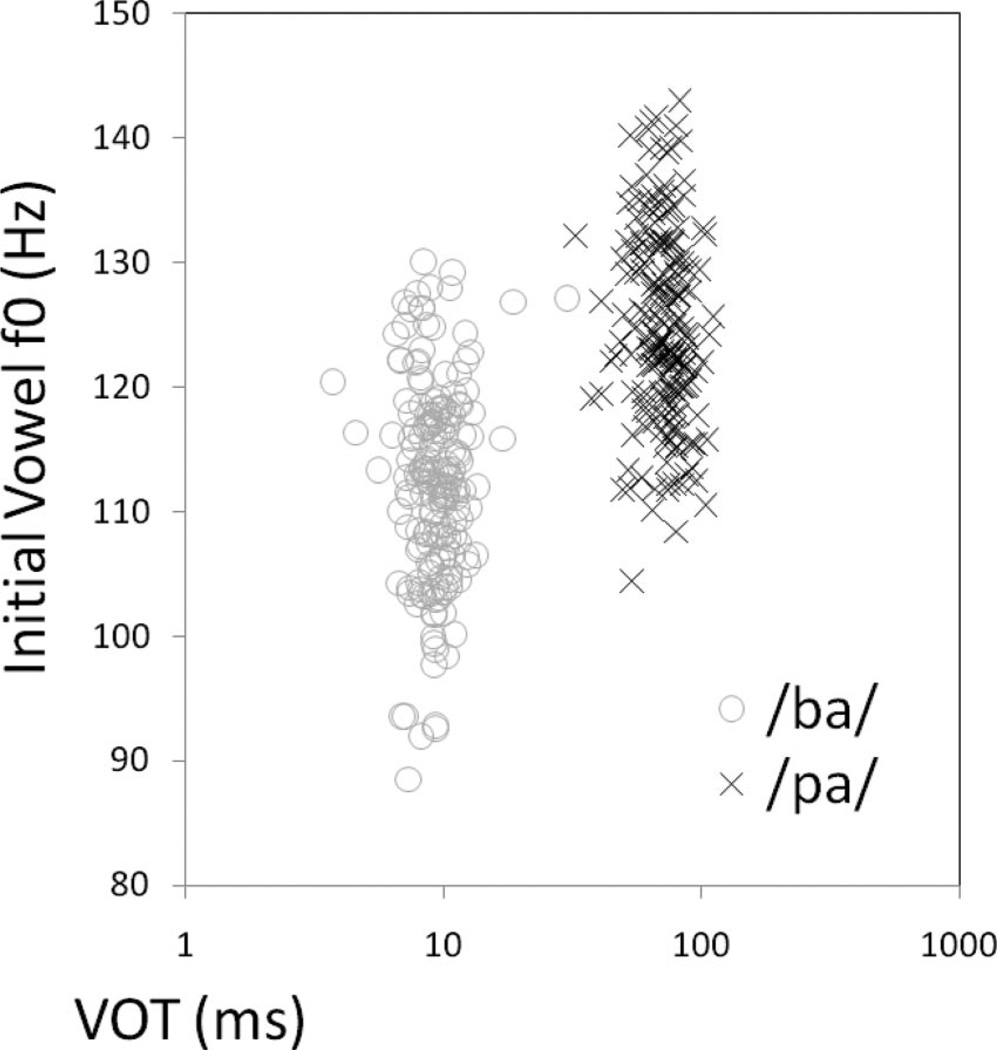
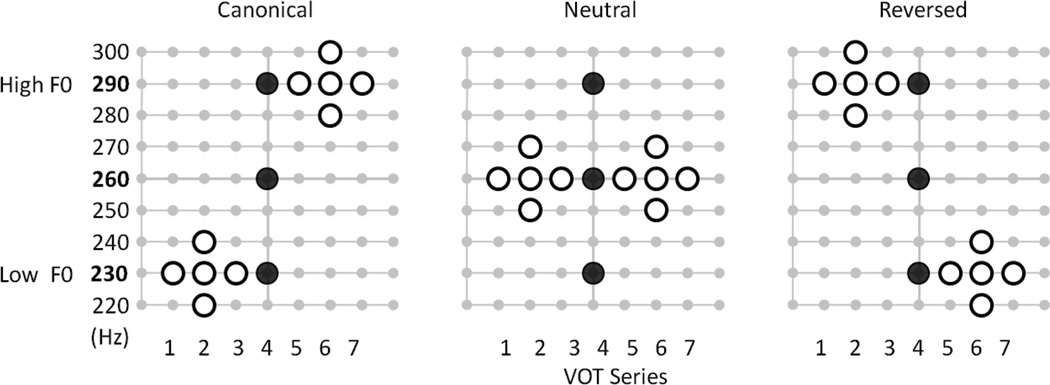
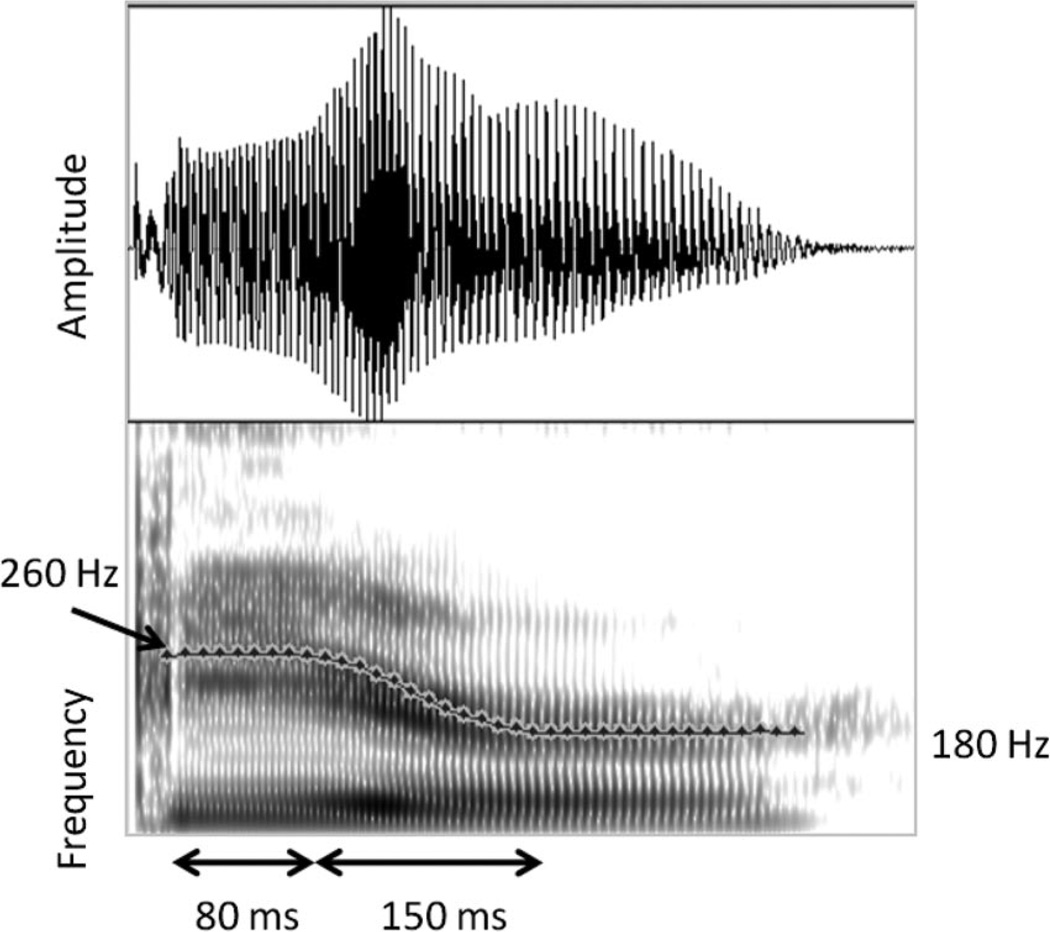
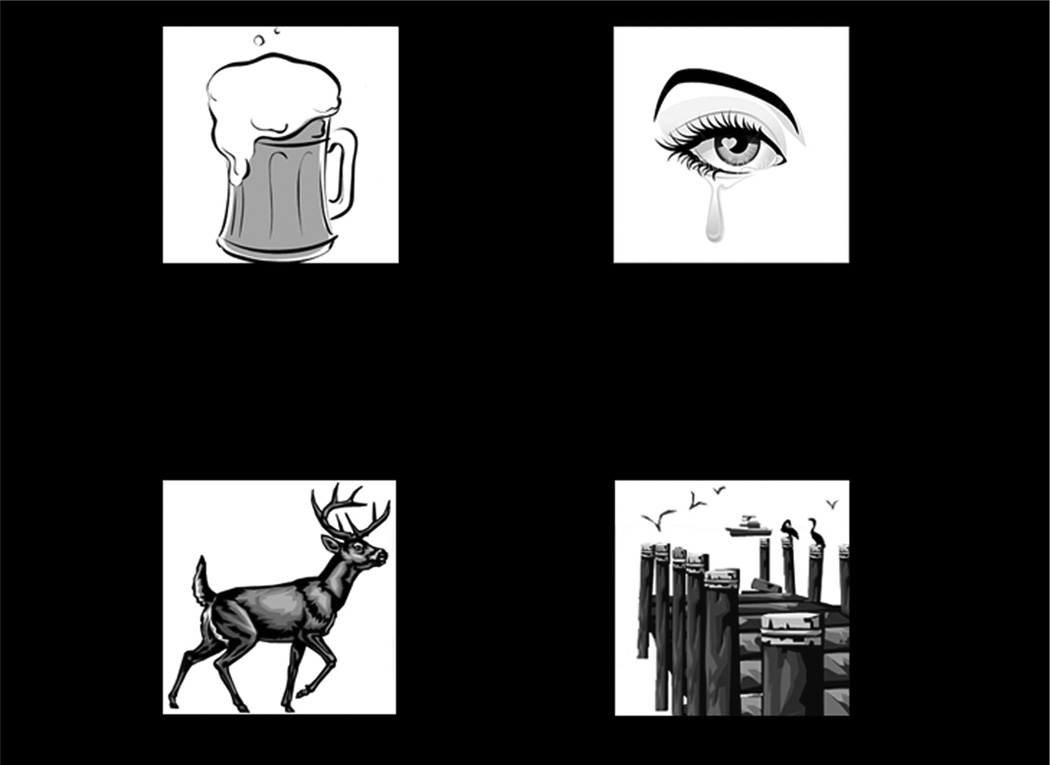
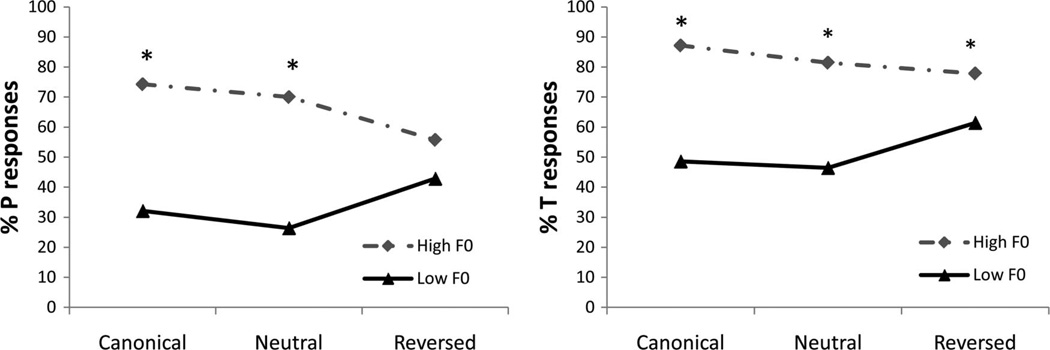
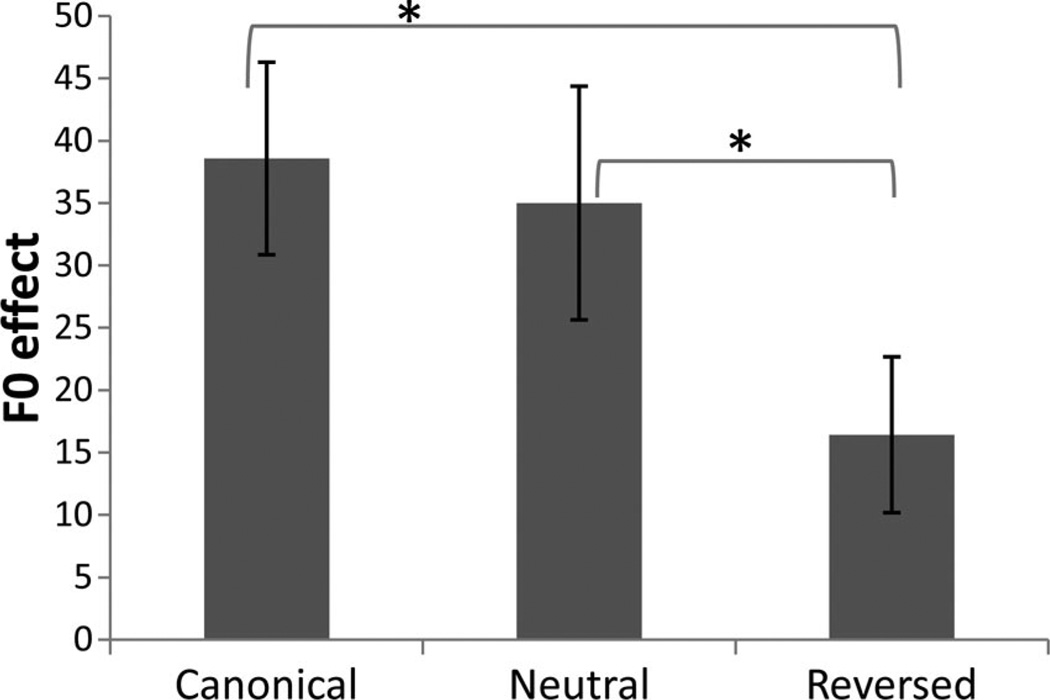
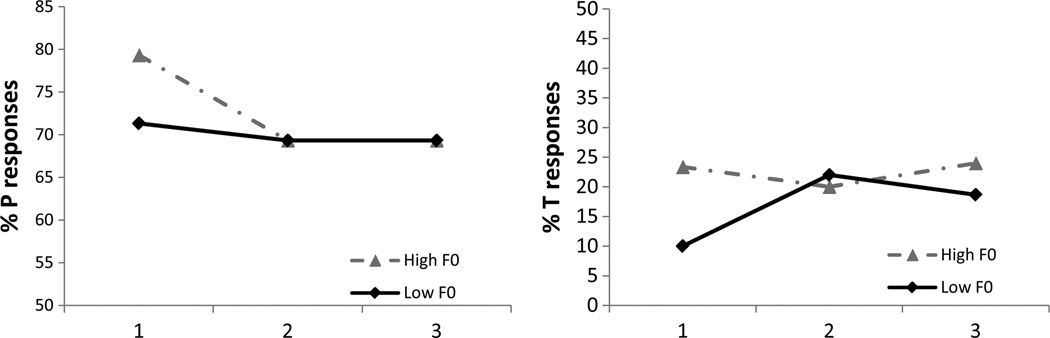
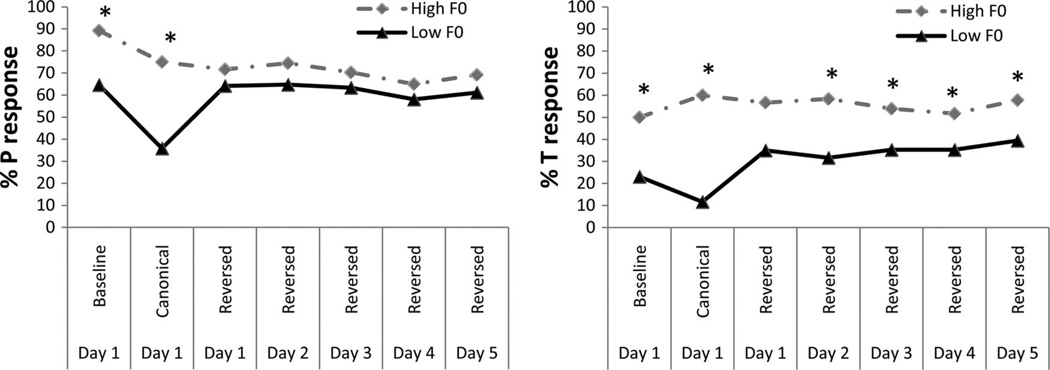
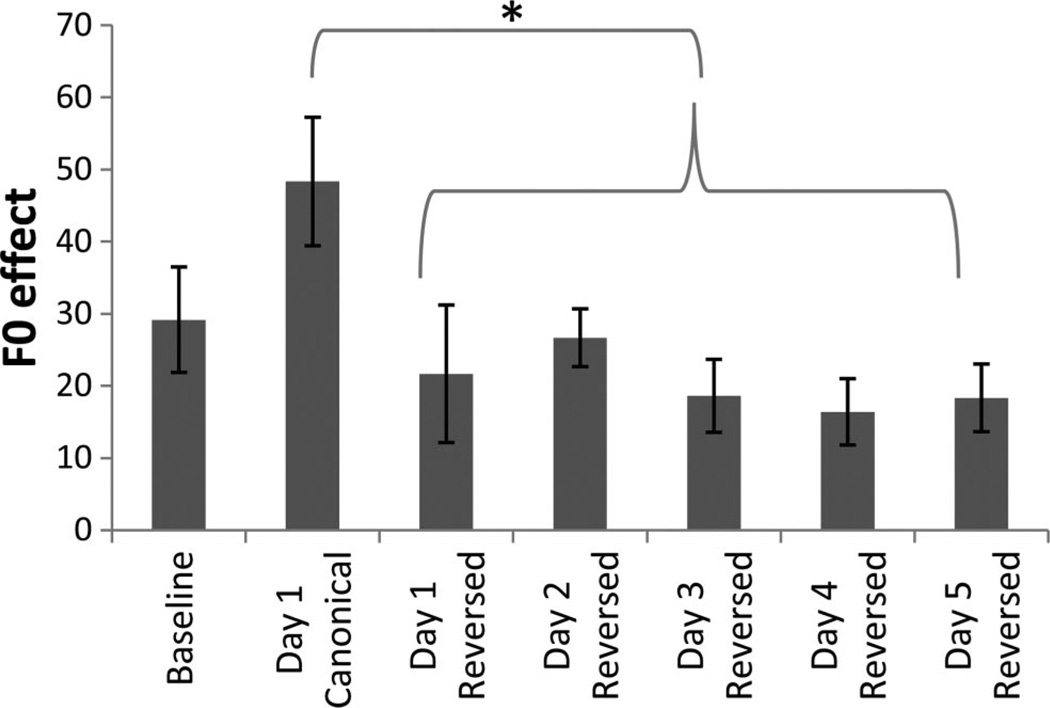
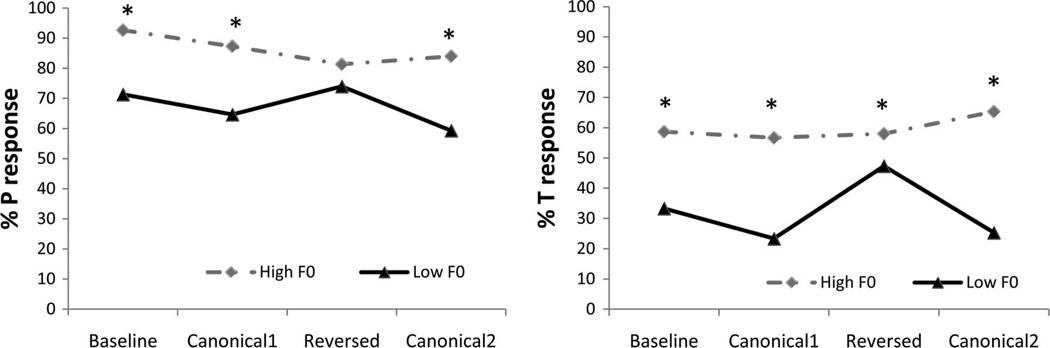
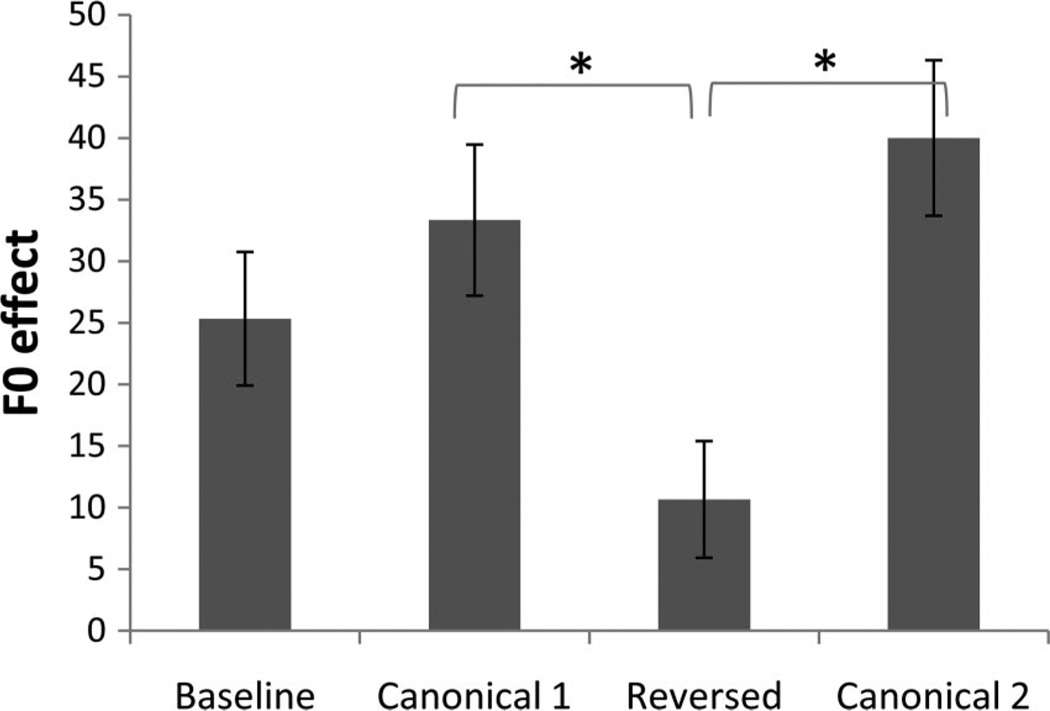
Speech processing requires sensitivity to long-term regularities of the native language yet demands listeners to flexibly adapt to perturbations that arise from talker idiosyncrasies such as nonnative accent. The present experiments investigate whether listeners exhibit dimension-based statistical learning of correlations between acoustic dimensions defining perceptual space for a given speech segment. While engaged in a word recognition task guided by a perceptually unambiguous voice-onset time (VOT) acoustics to signal beer, pier, deer, or tear, listeners were exposed incidentally to an artificial "accent" deviating from English norms in its correlation of the pitch onset of the following vowel (F0) to VOT. Results across four experiments are indicative of rapid, dimension-based statistical learning; reliance on the F0 dimension in word recognition was rapidly down-weighted in response to the perturbation of the correlation between F0 and VOT dimensions. However, listeners did not simply mirror the short-term input statistics. Instead, response patterns were consistent with a lingering influence of sensitivity to the long-term regularities of English. This suggests that the very acoustic dimensions defining perceptual space are not fixed and, rather, are dynamically and rapidly adjusted to the idiosyncrasies of local experience, such as might arise from nonnative-accent, dialect, or dysarthria. The current findings extend demonstrations of "object-based" statistical learning across speech segments to include incidental, online statistical learning of regularities residing within a speech segment.


Figures

Figure 1
Figure 1
Fundamental frequency (F0 of the following vowel, in Hz) and voice onset time (VOT, in ms) are plotted for 400 utterances of syllable-initial [b] and [p] by a single male talker. Note the correlation between F0 and VOT such that voiceless [p], with longer VOT, tends to be produced with relatively higher F0 frequencies.
Figure 2
Figure 2
Schematic illustration of stimulus distributions across experiment blocks, defined by the VOT dimension in stimulus step (horizontal axis, see text for VOT values in ms) and F0 dimension (vertical axis, in Hz). Clear dots were exposure stimuli, and filled dots were critical test stimuli.
Figure 3
Figure 3
Waveform and spectrographic representation of a stimulus, pier, showing mid-F0 onset (260 Hz).
Figure 4
Figure 4
Images displayed on the computer monitor as response choices.
Figure 5
Figure 5
Percent voiceless responses for beer–pier series (left) and deer–tear series (right) across three exposure blocks (canonical, neutral, and reversed) in Experiment 1. Responses only to ambiguous test stimuli are plotted. Separate lines represent low-F0 (230 Hz) and high-F0 (290 Hz) conditions.
Figure 6
Figure 6
F0 effect (difference in percent voiceless responses between high and low F0 test trials) for deer–tear series across three exposure blocks (natural, neutral and reversed) in Experiment 1. Error bars indicate 1 standard error.
Figure 7
Figure 7
Percent voiceless responses for beer–pier series (left) and deer–tear series (right) across three phases of Experiment 2. Responses only to ambiguous test stimuli are plotted. Separate lines represent low-F0 (230 Hz) and high-F0 (290 Hz) conditions.
Figure 8
Figure 8
Percent voiceless responses for beer–pier series (left) and deer–tear series (right) across experimental blocks across 5 days in Experiment 3. Responses only to ambiguous test stimuli are plotted. Separate lines represent low-F0 (230 Hz) and high-F0 (290 Hz) conditions.
Figure 9
Figure 9
F0 effect (difference in percent voiceless responses between high and low F0 test trials) for deer–tear series across experimental blocks across 5 days in Experiment 3. Error bars indicate 1 standard error.
Figure 10
Figure 10
Percent voiceless responses for beer–pier series (left) and deer–tear series (right) across experimental blocks (baseline, canonical 1, reversed, canonical 2) in Experiment 4. Responses only to ambiguous test stimuli are plotted. Separate lines represent low-F0 (230 Hz) and high-F0 (290 Hz) conditions.
Figure 11
Figure 11
F0 effect (difference in percent voiceless responses between high and low F0 test trials) for deer–tear series across experimental blocks in Experiment 4. Error bars indicate 1 standard error.

Similar articles

Cited by

References

    1. Abramson AS, Lisker L. Relative power of cues: F0 shift versus voice timing. In: Fromkin V, editor. Phonetic linguistics: Essays in honor of Peter Ladefoged. New York, NY: Academic; 1985. pp. 25–33.
    1. Bertelson P, Vroomen J, De Gelder B. Visual recalibration of auditory speech identification: A McGurk aftereffect. Psychological Science. 2003;14:592–597. - PubMed
    1. Boersma P, Weenink D. Praat: Doing phonetics by computer [Computer program]. Version 5.0. 2010 retrieved from http://www.praat.org/
    1. Castleman WA, Diehl RL. Effects of fundamental frequency on medial and final [voice] judgments. Journal of Phonetics. 1996;24:383–398.
    1. Chistovich LA. Variations of the fundamental voice pitch as a discriminatory cue for consonants. Soviet Physics-Acoustics. 1969;14

Publication types