. 2012 May;38(3):525-549.
doi: 10.1037/a0025896. Epub 2011 Oct 17.

Drifting from slow to "D'oh!": working memory capacity and mind wandering predict extreme reaction times and executive control errors

Affiliations

Drifting from slow to "D'oh!": working memory capacity and mind wandering predict extreme reaction times and executive control errors

Jennifer C McVay et al. J Exp Psychol Learn Mem Cogn. 2012 May.

Abstract

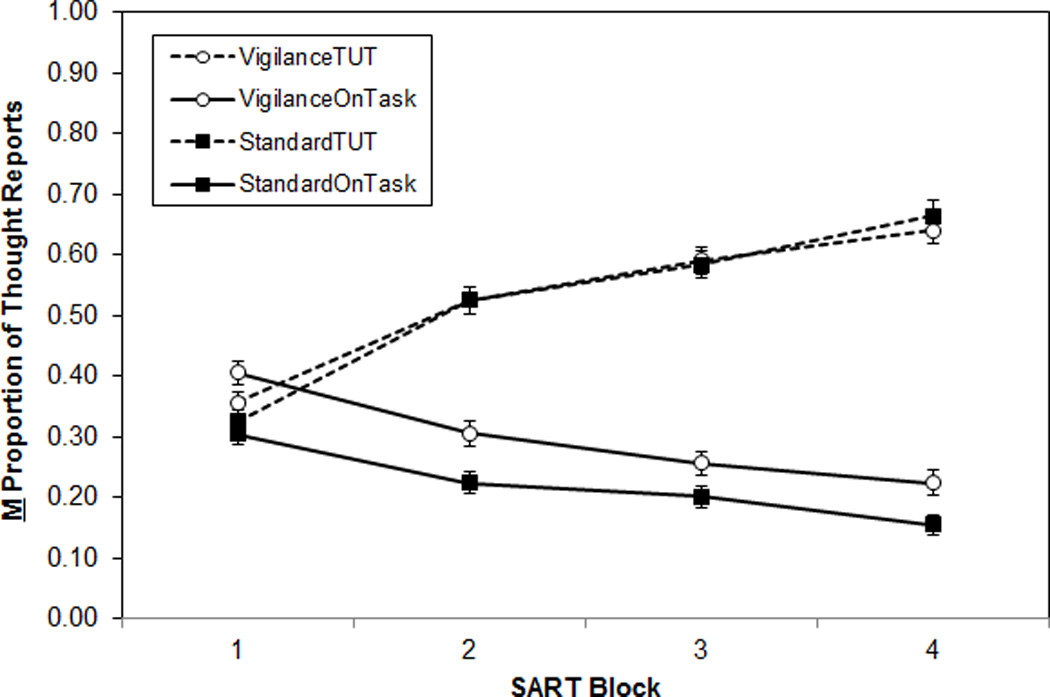
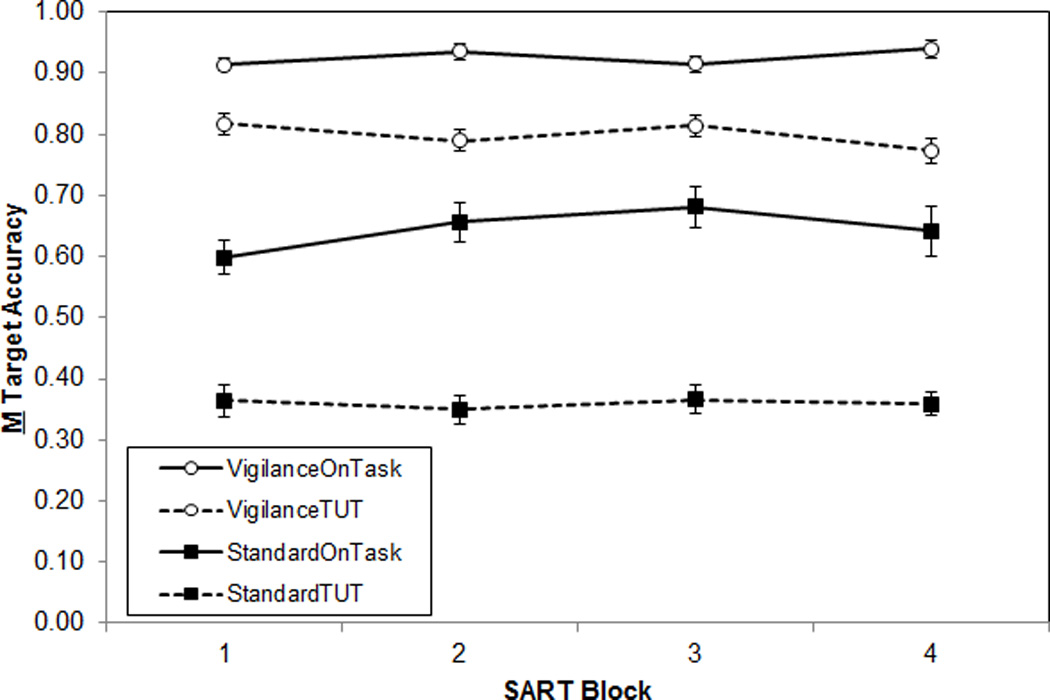
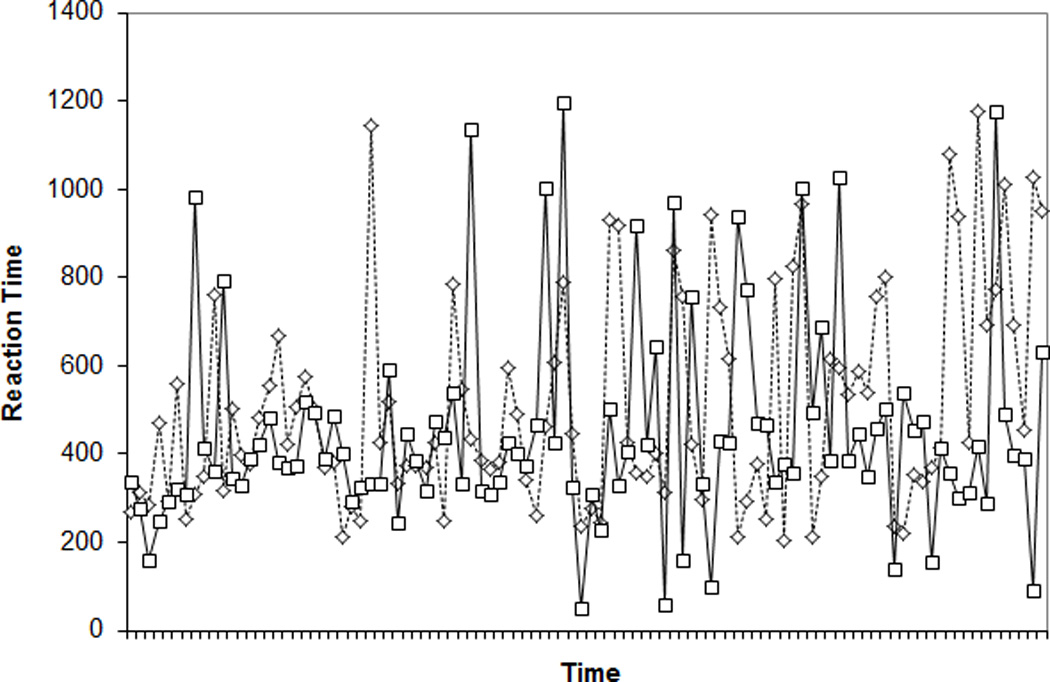
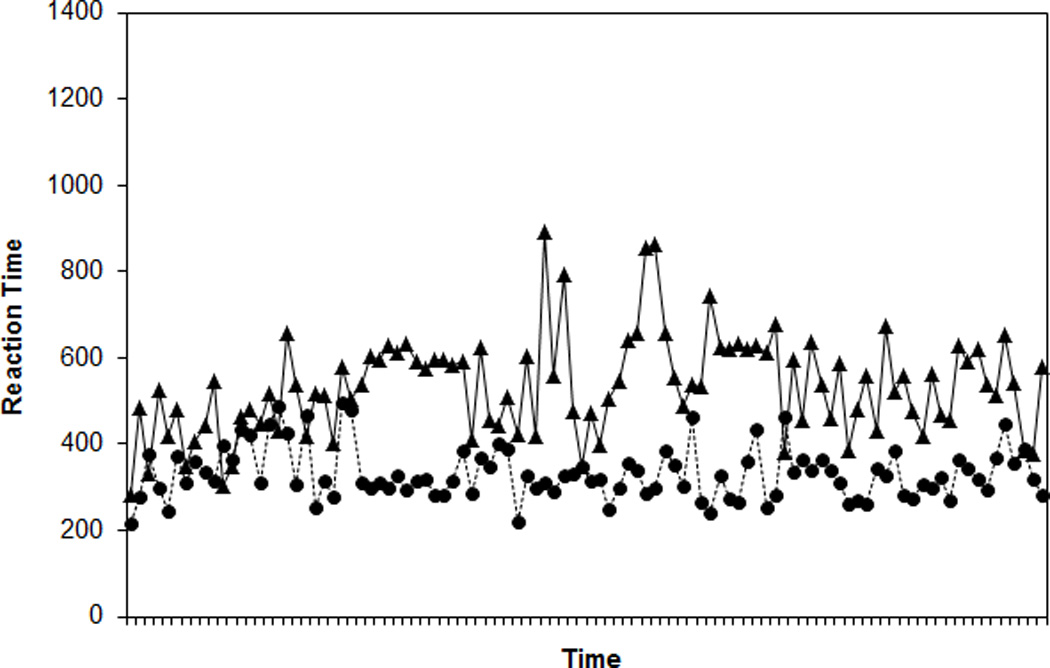
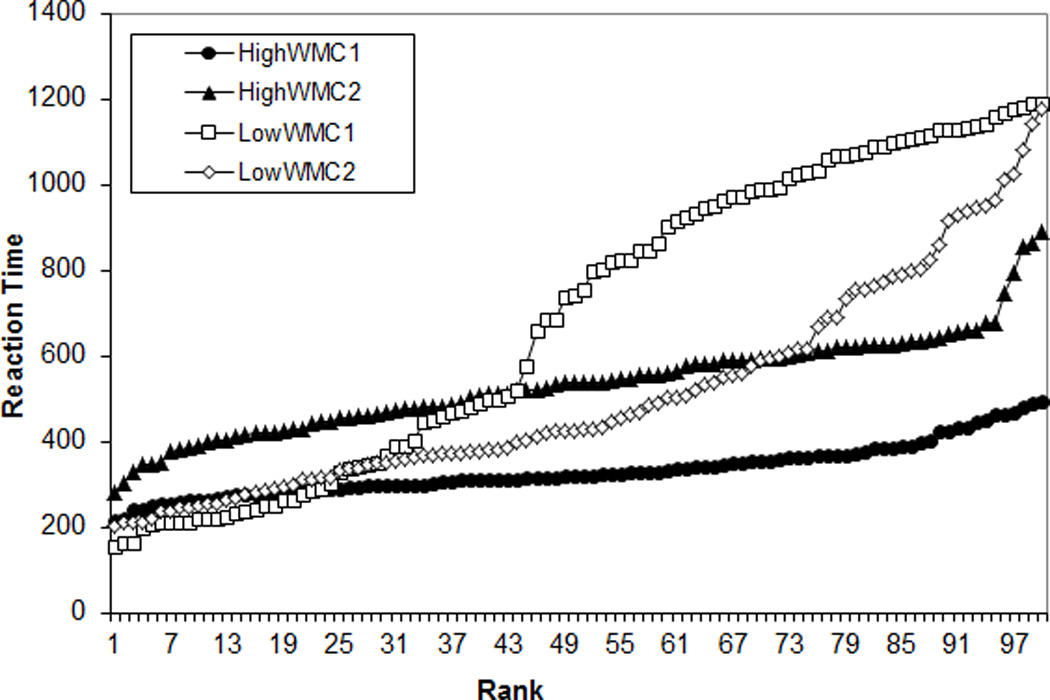
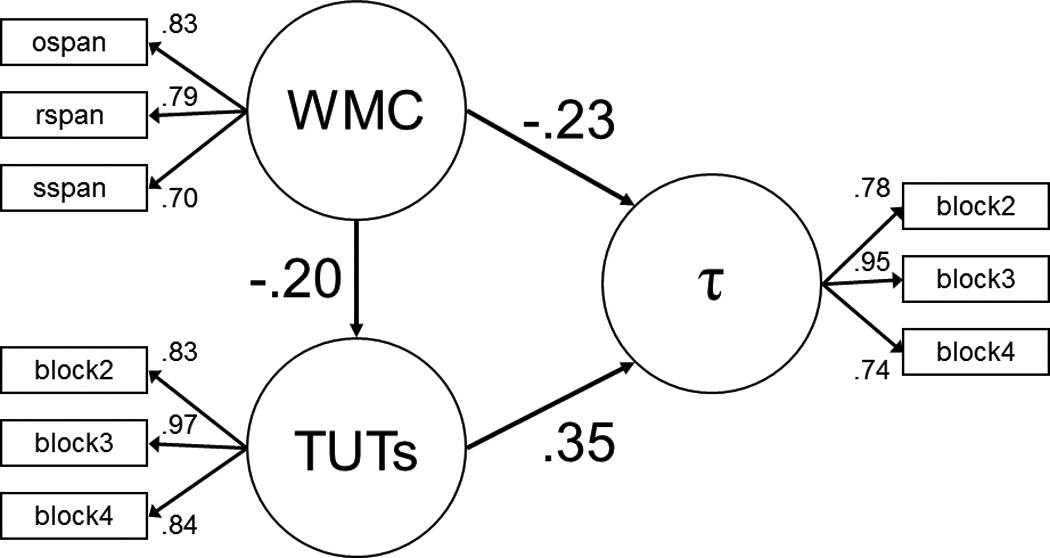
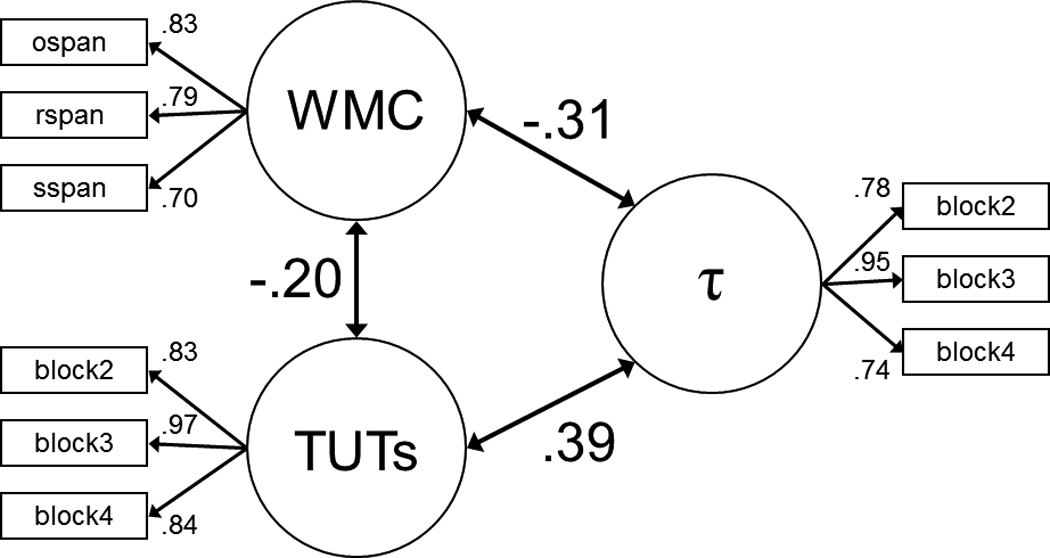
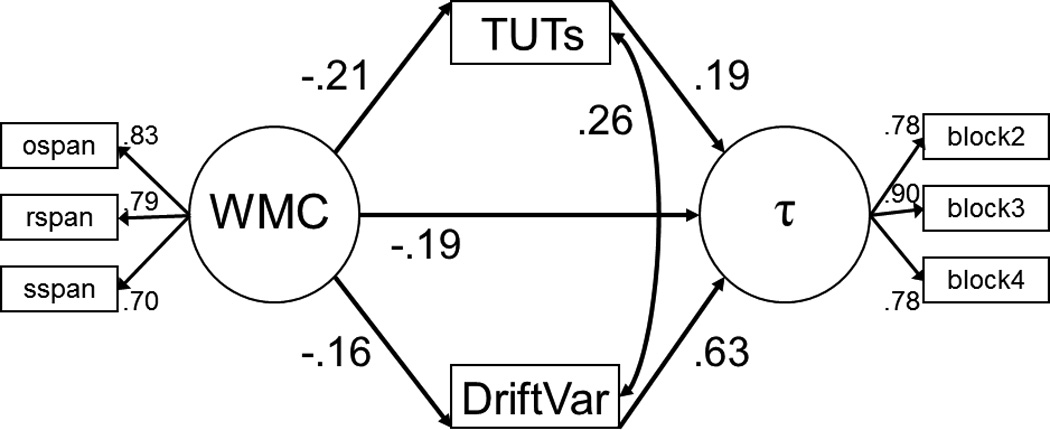
A combined experimental, individual-differences, and thought-sampling study tested the predictions of executive attention (e.g., Engle & Kane, 2004) and coordinative binding (e.g., Oberauer, Süβ, Wilhelm, & Sander, 2007) theories of working memory capacity (WMC). We assessed 288 subjects' WMC and their performance and mind-wandering rates during a sustained-attention task; subjects completed either a go/no-go version requiring executive control over habit or a vigilance version that did not. We further combined the data with those from McVay and Kane (2009) to (1) gauge the contributions of WMC and attentional lapses to the worst performance rule and the tail, or τ parameter, of reaction time (RT) distributions; (2) assess which parameters from a quantitative evidence-accumulation RT model were predicted by WMC and mind-wandering reports; and (3) consider intrasubject RT patterns--particularly, speeding--as potential objective markers of mind wandering. We found that WMC predicted action and thought control in only some conditions, that attentional lapses (indicated by task-unrelated-thought reports and drift-rate variability in evidence accumulation) contributed to τ, performance accuracy, and WMC's association with them and that mind-wandering experiences were not predicted by trial-to-trial RT changes, and so they cannot always be inferred from objective performance measures.


Figures

Figure 1
Figure 1
Mean proportion of thought reports, by SART type (Standard, Vigilance), by thought category (On-task, TUT), across task blocks (N = 284). Error bars represent standard errors. Note: TUT = task-unrelated thought; OnTask = on-task thought.
Figure 2
Figure 2
Mean accuracy on target trials, by SART type (Standard, Vigilance), by thought category (On-task, TUT), across task blocks (N = 284). Error bars represent standard errors. Note: TUT = task-unrelated thought; OnTask = on-task thought.
Figure 3
Figure 3
Response times (RTs) for 100 randomly selected trials for two randomly selected higher working memory capacity (WMC) subjects (Panel A) and two randomly selected lower WMC subjects (Panel B) from the Standard SART.
Figure 3
Figure 3
Response times (RTs) for 100 randomly selected trials for two randomly selected higher working memory capacity (WMC) subjects (Panel A) and two randomly selected lower WMC subjects (Panel B) from the Standard SART.
Figure 4
Figure 4
Ranked reaction times (RTs) for 100 randomly selected trials for two randomly selected higher working memory capacity (WMC) subjects and randomly selected lower WMC subjects from the Standard SART; HiWMC = higher WMC subject; LoWMC = lower WMC subject.
Figure 5
Figure 5
Latent variable analyses testing the relations among working memory capacity, TUT rate (measured across SART blocks 2 – 4), and the RT parameter τ (measured across SART blocks 2 – 4). Circles represent latent variables and square boxes represent observed variables. Panel A: Confirmatory factor analysis; double-headed arrows connecting latent variables (circles) to each other represent the correlations between the constructs, and numbers appearing next to each single-headed arrow represent the loadings for each manifest variable (box) onto the latent variable. Panel B: Structural equation model with TUT rate as a partial mediator of the WMC-τ association; single-headed arrows connecting latent variables with each other are analogous to semipartial correlations between these constructs. All depicted path coefficients are statistically significant. Note: WMC = working memory capacity; TUTs = task-unrelated thought rate.
Figure 5
Figure 5
Latent variable analyses testing the relations among working memory capacity, TUT rate (measured across SART blocks 2 – 4), and the RT parameter τ (measured across SART blocks 2 – 4). Circles represent latent variables and square boxes represent observed variables. Panel A: Confirmatory factor analysis; double-headed arrows connecting latent variables (circles) to each other represent the correlations between the constructs, and numbers appearing next to each single-headed arrow represent the loadings for each manifest variable (box) onto the latent variable. Panel B: Structural equation model with TUT rate as a partial mediator of the WMC-τ association; single-headed arrows connecting latent variables with each other are analogous to semipartial correlations between these constructs. All depicted path coefficients are statistically significant. Note: WMC = working memory capacity; TUTs = task-unrelated thought rate.
Figure 6
Figure 6
Structural equation model testing for mediation of the WMC-tau association by two indices of attentional lapses: TUT rate and DriftVar. Circles represent latent variables and square boxes represent observed variables. All depicted path coefficients are statistically significant. Note: WMC = working memory capacity; TUTs = task-unrelated thought rate; DriftVar = drift rate variability parameter from the linear ballistic accumulator (LBA) model; Block 2 – Block 4 = SART block 2 – block 4.
Figure 7
Figure 7
Component scores, by target accuracy, calculated using three-component principal-components analysis on accurate non-target reaction time (RT) sequences in the Standard SART (Nseries = 3427). Error bars represent standard errors.
Figure 8
Figure 8
Component scores, by thought report, calculated using three-component principal-components analysis on accurate non-target reaction time (RT) sequences in the Standard SART (Nseries = 2693). Error bars represent standard errors. Note: Task = on-task thought; TRI = task-related interference; TUT = task-unrelated thought.

References

    1. Alloway TP, Gathercole SE, Kirkwood H, Elliott J. The cognitive and behavioral characteristics of children with low working memory. Child Development. 2009;80:606–621. - PubMed
    1. Antrobus JS, Coleman R, Singer JL. Signal-detection performance by subjects differing in predisposition to daydreaming. Journal of Consulting Psychology. 1967;31:487–491. - PubMed
    1. Antrobus JS, Singer JL, Greenberg S. Studies in the stream of consciousness: Experimental enhancement and suppression of spontaneous cognitive processes. Perceptual and Motor Skills. 1966;23:399–417.
    1. Barrouillet P, Lépine R, Camos V. Is the influence of working memory capacity on highlevel cognition mediated by complexity or resource-dependent elementary processes? Psychonomic Bulletin & Review. 2008;15:528–534. - PubMed
    1. Beilock SL, Carr TH. On the fragility of skilled performance: What governs choking under pressure? Journal of Experimental Psychology: General. 2001;4:701–225. - PubMed

Publication types