. 2012 Feb 1;16(3):203-16.
doi: 10.1089/ars.2011.3882. Epub 2011 Oct 17.

Hydrogen sulfide inhibits hypoxia- but not anoxia-induced hypoxia-inducible factor 1 activation in a von hippel-lindau- and mitochondria-dependent manner

Affiliations

Hydrogen sulfide inhibits hypoxia- but not anoxia-induced hypoxia-inducible factor 1 activation in a von hippel-lindau- and mitochondria-dependent manner

Shinichi Kai et al. Antioxid Redox Signal. .

Abstract

Aims: In addition to nitric oxide and carbon monoxide, hydrogen sulfide (H(2)S) is an endogenously synthesized gaseous molecule that acts as an important signaling molecule in the living body. Transcription factor hypoxia-inducible factor 1 (HIF-1) is known to respond to intracellular reduced oxygen (O(2)) availability, which is regulated by an elaborate balance between O(2) supply and demand. However, the effect of H(2)S on HIF-1 activity under hypoxic conditions is largely unknown in mammalian cells. In this study, we tried to elucidate the effect of H(2)S on hypoxia-induced HIF-1 activation adopting cultured cells and mice.

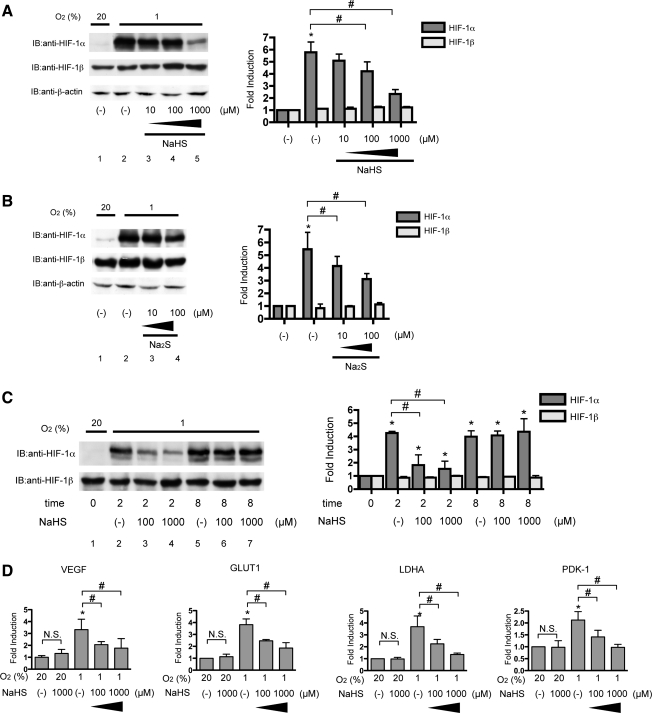
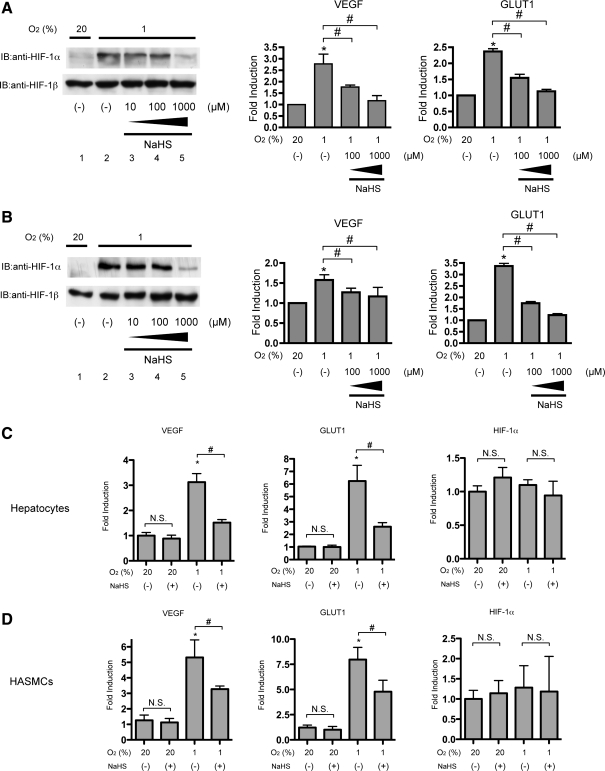
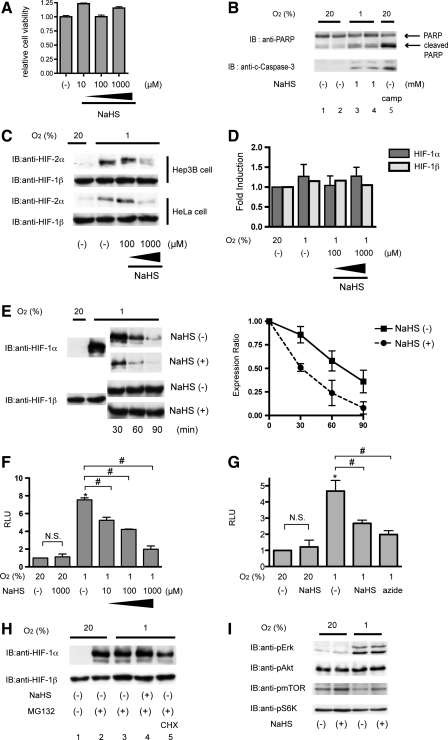
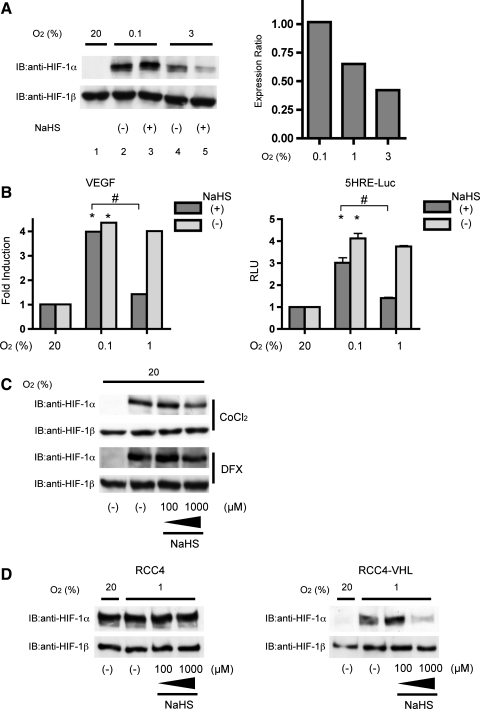
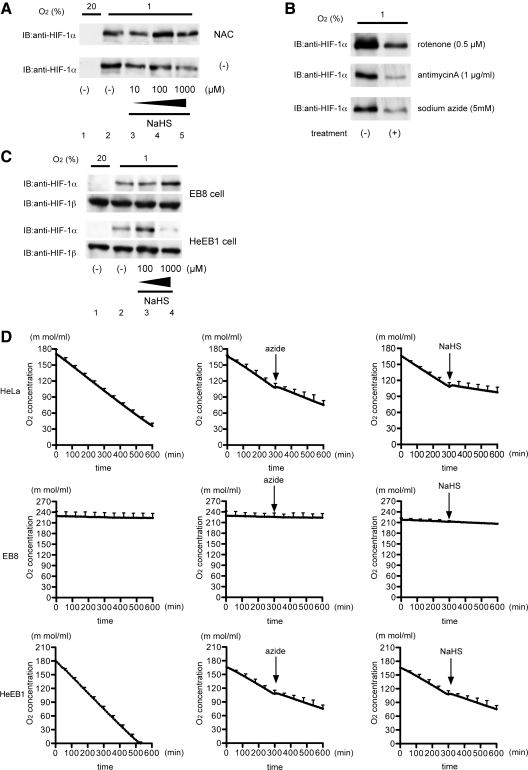
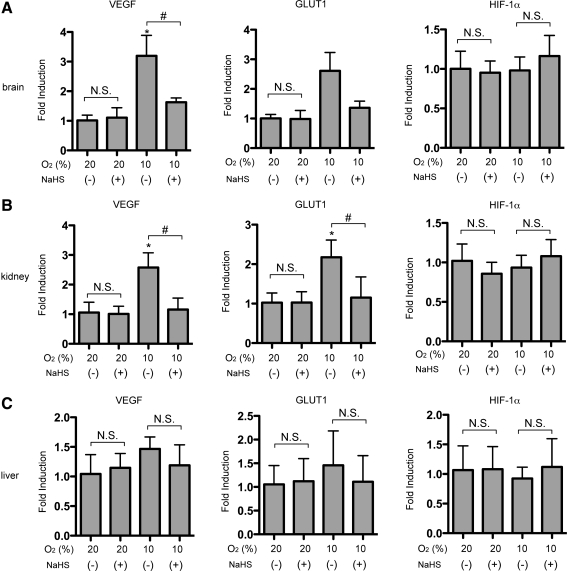
Results: The H(2)S donors sodium hydrosulfide and sodium sulfide in pharmacological concentrations reversibly reduced cellular O(2) consumption and inhibited hypoxia- but not anoxia-induced HIF-1α protein accumulation and expression of genes downstream of HIF-1 in established cell lines. H(2)S did not affect HIF-1 activation induced by the HIF-α hydroxylases inhibitors desferrioxamine or CoCl(2). Experimental evidence adopting von Hippel-Lindau (VHL)- or mitochondria-deficient cells indicated that H(2)S did not affect neosynthesis of HIF-1α protein but destabilized HIF-1α in a VHL- and mitochondria-dependent manner. We also demonstrate that exogenously administered H(2)S inhibited HIF-1-dependent gene expression in mice.

Innovation: For the first time, we show that H(2)S modulates intracellular O(2) homeostasis and regulates activation of HIF-1 and the subsequent gene expression induced by hypoxia by using an in vitro system with established cell lines and an in vivo system in mice.

Conclusions: We demonstrate that H(2)S inhibits hypoxia-induced HIF-1 activation in a VHL- and mitochondria-dependent manner.


Figures

FIG. 1.
FIG. 1.
Hydrogen sulfide donors inhibited 1% O2-induced HIF-1 protein expression and HIF-1–dependent gene expression. Hep3B cells were exposed to the indicated concentrations of NaHS (A) or Na2S (B) for 4 h under 20% or 1% O2. After treatment, cells were harvested, and whole-cell lysates were subjected to an immunoblot assay for HIF-1α, HIF-1β, or β-actin protein expression. (C) Hep3B cells were exposed to the indicated concentrations of NaHS for 2 or 8 h under 20% or 1% O2. Experiments were repeated thrice. Representative immunoblots are shown (A, B, and C; left panels). Band intensities were densitometrically analyzed. Fold induction relative to lane 1 was plotted as mean±SD (A and B; right panels). *p<0.05 compared with control; #p<0.05 for comparisons between the indicated groups. (D) Hep3B cells were exposed to the indicated concentrations of NaHS for 8 h under 20% or 1% O2 and harvested for semi-quantitative RT-PCR for vascular endothelial growth factor (VEGF), glucose transporter 1 (GLUT1), Lactate dehydrogenase A (LDHA), and pyruvate dehydrogenase kinase-1 (PDK-1). Experiments were repeated at least thrice in triplicate. *p<0.05 compared with the control (20% and no treatment), #p<0.05 for comparisons between the indicated groups. N.S., not statistically significant; HIF-1, hypoxia-inducible factor 1; NaHS, sodium hydrosulfide; Na2S, sodium sulfide.
FIG. 2.
FIG. 2.
Inhibition of HIF-1 by NaHS was observed in cells from various kinds of tissues. SH-SY5Y cells (A) or HeLa cells (B) were exposed to the indicated concentrations of NaHS for 4 h under 20% or 1% O2. After treatment, cells were harvested for Western blot analysis, and whole-cell lysates were subjected to an immunoblot assay for HIF-1α and HIF-1β (A and B). Representative immunoblots are shown (A and B; left panels). SH-SY5Y cells (A; right panel), HeLa cells (B; right panel), primary cultured mouse hepatocytes (C), or human aortic smooth muscle cells (HASMCs) (D) were exposed to the indicated concentrations of NaHS for 8 h under 20% or 1% O2 and harvested for semi-quantitative RT-PCR by using primer pairs for indicated genes. Experiments were repeated at least thrice in triplicate. *p<0.05 compared with the control (20% and no treatment), #p<0.05 for comparisons between the indicated groups.
FIG. 3.
FIG. 3.
NaHS inhibited hypoxia-induced HIF-1α stabilization. (A and B) Hep3B cells were exposed to the indicated concentrations of NaHS for 4 h under 20% O2 conditions and subjected to a cytotoxicity assay by using MTS/PES as described in Materials and Methods section (A), and cells were subjected to an immunoblot assay for PARP and cleaved Caspase 3 expression (B). c-caspase-3; cleaved Caspase 3 (C) Hep3B cells or HeLa cells were exposed to the indicated concentrations of NaHS for 4 h under 20% or 1% O2. After treatment, cells were harvested for Western blot analysis, and whole-cell lysates were subjected to an immunoblot assay for HIF-1α or HIF-2α. (D) Hep3B cells were exposed to the indicated concentrations of NaHS for 8 h under 20% or 1% O2 and harvested for semi-quantitative RT-PCR by using primer sets for HIF-1α and HIF-1β. (E) Hep3B cells were exposed to 1% O2 for 4 h, and then cycloheximide (CHX) was added to a final concentration of 100 μM with or without 100 μM NaHS in a hypoxic workstation. Cells were incubated for 0–90 min, and whole-cell lysates were subjected to an immunoblot assay by using anti-HIF-1α or anti-HIF-1β antibodies (left panel). Relative intensities of HIF-1α signals were quantified by densitometric analysis of the immunoblots. Normalized values to time 0 as 1 were plotted against time (right panel). A representative blot is shown in the left panel. Results are mean±SD of three independent experiments. (F) Hep3B cells were transfected with the HIF-1–dependent reporter gene p2.1, encoding firefly luciferase, downstream of an HRE and SV40 promoter, and pRL-SV40, encoding Renilla luciferase. After 6-h incubation, cells were treated with the indicated concentrations of NaHS for 4 h. The ratio of firefly to Renilla luciferase activity was normalized to the value obtained for untreated cells to obtain a relative light unit (RLU). Results are mean±SD of three independent transfections. *p<0.05 compared with respective control; #p<0.05 for comparisons between the indicated groups (G) HeLa/ODD-Luc cells were exposed to 20% or 1% O2 conditions under treatment with 1000 μM NaHS or 2000 μM sodium azide for 4 h. Cells were harvested, and luciferase activity in each well was measured by using the same amount of cell lysate in the dual-luciferase reporter assay system (Promega). The luciferase activity was normalized to the value obtained for untreated cells to obtain a relative light unit (RLU). Results are mean±SD of three independent wells. *p<0.05 compared with respective control under 20% O2 conditions; #p<0.05 for comparisons between the indicated groups (H) Hep3B cells were treated with 1000 μM NaHS, 10 μM MG132, and/or 100 μM CHX for 4 h under 1% O2 and harvested for immunoblot assays for HIF-1α and HIF-1β. (I) Hep3B cells were exposed to 1000 μM NaHS under 20% and 1% O2 for 1 h. Cells were harvested, and lysates were subjected to an immunoblot assay. The phosphorylation status of Erk1/2, Akt, mTOR, and p70 S6K was examined in an immunoblot assay with anti-phosphospecific antibodies raised against the respective kinases. HRE, hypoxia-response element.
FIG. 4.
FIG. 4.
NaHS inhibited hypoxia-induced but not anoxia-induced HIF-1α protein expression. (A) Hep3B cells were exposed to 1000 μM NaHS for 4 h under 20%, 3%, 1%, or 0.1% O2. Cells were harvested for Western blot analysis after treatment. Whole-cell lysates were subjected to an immunoblot assay for HIF-1α and HIF-1β. A representative immunoblot is shown (A; left panel). Band intensities were densitometrically analyzed from two independent immunoblots, and mean relative expression ratios of band density of NaHS-treated cells to those of cells without NaHS treatment are shown (A; right panel). (B) Hep3B cells were exposed to 1000 μM NaHS for 8 h under 20%, 1%, or 0.1% O2 and harvested for semi-quantitative RT-PCR with a primer set for VEGF. Results are mean±SD of three independent experiments (B; left panel). HeLa/5HRE-Luc cells were treated with the 1000 μM NaHS for 8 h under 20%, 1%, and 0.1% O2. The firefly luciferase activity was determined and normalized to the value required for untreated cells to obtain relative light units (RLU) (B; right panel). Results are mean±SD of three independent transfections. *p<0.05 compared with the control, #p<0.05 for comparisons between the indicated groups. (C) Hep3B cells were exposed to 100 μM CoCl2 or 100 μM DFX with or without the indicated concentrations of NaHS for 4 h. (D) RCC4 and RCC4-von Hippel-Lindau cells were exposed to 20% and 1% O2 with or without 1000 μM NaHS for 4 h. After treatment, cells were harvested, and whole-cell lysates were subjected to immunoblot assay for HIF-1α and HIF-1β.
FIG. 5.
FIG. 5.
Involvement of mitochondria in inhibition of HIF-1 activation by NaHS. (A) Hep3B cells were exposed to the indicated concentrations of NaHS with or without 10 mM NAC treatment for 4 h and harvested for immunoblot assays with anti-HIF-1α. (B) Hep3B cells were exposed to 1% O2 with (+) or without (−) treatment with the indicated reagents (0.5 μM rotenone, 1 μg/ml antimycin A, and 5 mM sodium azide). After treatment, cells were harvested, and whole-cell lysates were subjected to an immunoblot assay for HIF-1α. (C) EB8 and HeEB1 cells were exposed to 20% and 1% O2 and treated with the indicated concentrations of NaHS for 4 h. After treatment, the cells were harvested, and whole-cell lysates were subjected to an immunoblot assay for HIF-1α and HIF-1β. (D) Oxygen concentration curves were generated by using a Clark electrode for HeLa, EB8, and HeEB1 cell suspensions. Arrows indicate addition of 2 mM sodium azide or 1 mM NaHS. The slope of the curve is a measure of the rate of O2 consumption.
FIG. 6.
FIG. 6.
NaHS inhibited HIF-1–dependent gene expression in vivo. NaHS (2.0 mg/kg) was intraperitoneally administered to mice under 20% and 10% O2 atmosphere for 4 h. VEGF, GLUT-1, and HIF-1α mRNA levels in brain (A), kidney (B), and liver (C) were analyzed by quantitative real-time RT-PCR. Results are mean±SD of three independent mice. *p<0.05 compared with the control (20% and no treatment), #p<0.05 for comparisons between the indicated groups.

Similar articles

Cited by

References

    1. Azuma H. Hirose T. Fujii H. Oe S. Yasuchika K. Fujikawa T. Yamaoka Y. Enrichment of hepatic progenitor cells from adult mouse liver. Hepatology. 2003;37:1385–1394. - PubMed
    1. Budde M. Roth M. Hydrogen sulfide increases HIF-1 activity independent of VHL-1 in C. elegans. Mol Biol Cell. 2010;21:212–217. - PMC - PubMed
    1. Chin BY. Jiang G. Wegiel B. Wang HJ. Macdonald T. Zhang XC. Gallo D. Cszimadia E. Bach FH. Lee PJ. Otterbein LE. Hypoxia-inducible factor 1alpha stabilization by carbon monoxide results in cytoprotective preconditioning. Proc Natl Acad Sci USA. 2007;104:5109–5114. - PMC - PubMed
    1. Cooper CE. Brown GC. The inhibition of mitochondrial cytochrome oxidase by the gases carbon monoxide, nitric oxide, hydrogen cyanide and hydrogen sulfide: chemical mechanism and physiological significance. J Bioenerg Biomembr. 2008;40:533–539. - PubMed
    1. Early MA. Lishnevsky M. Gilchrist JM. Higgins DM. Orme IM. Muller WA. Gonzalez-Juarerro M. Schenkel AR. Non-invasive diagnosis of early pulmonary disease in PECAM-deficient mice using infrared pulse oximetry. Exp Mol Pathol. 2009;87:152–158. - PMC - PubMed

Publication types

MeSH terms

Substances

LinkOut - more resources