. 2011 Nov;121(11):4548-66.
doi: 10.1172/JCI57734. Epub 2011 Oct 17.

Calpain mediates pulmonary vascular remodeling in rodent models of pulmonary hypertension, and its inhibition attenuates pathologic features of disease

Affiliations

Calpain mediates pulmonary vascular remodeling in rodent models of pulmonary hypertension, and its inhibition attenuates pathologic features of disease

Wanli Ma et al. J Clin Invest. 2011 Nov.

Abstract

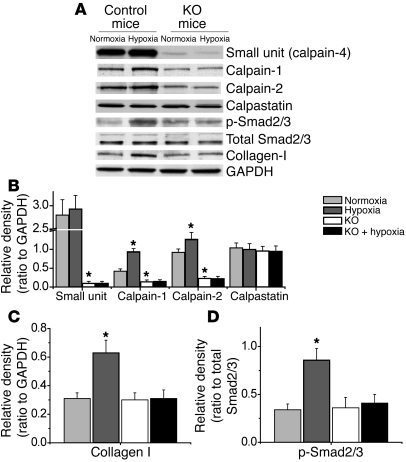
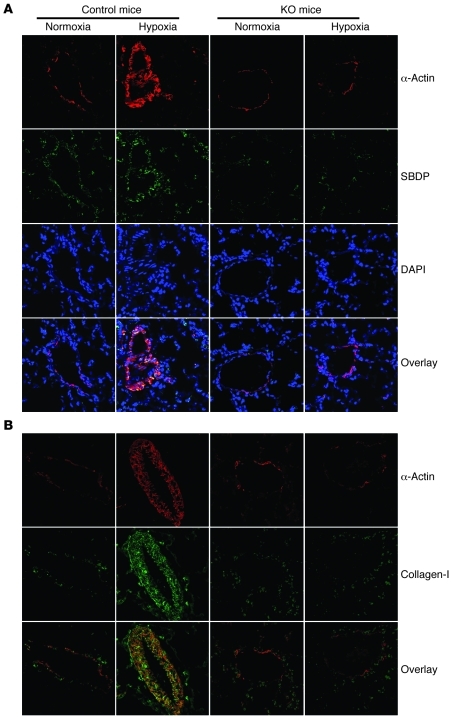
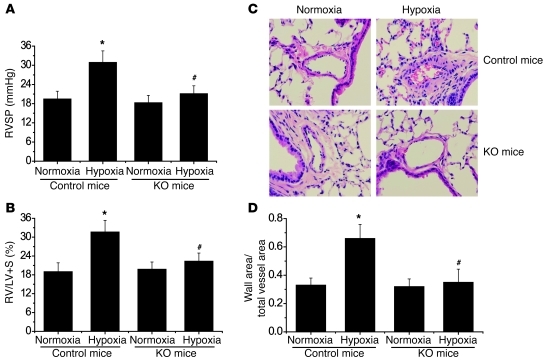
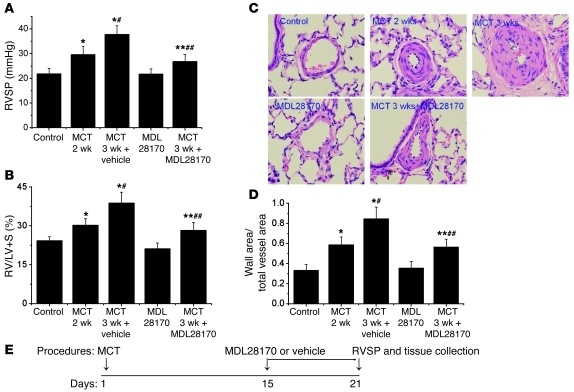
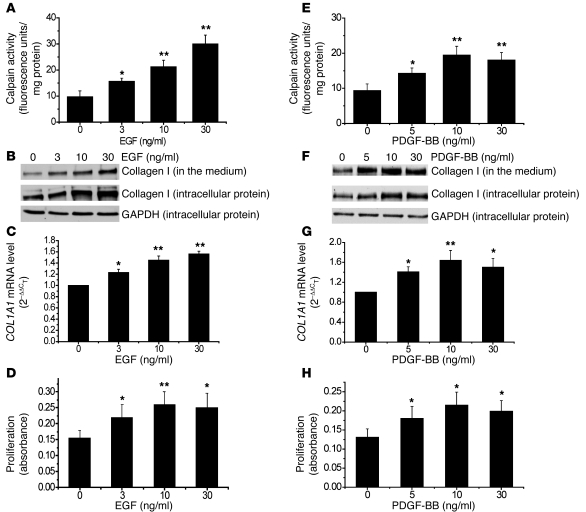
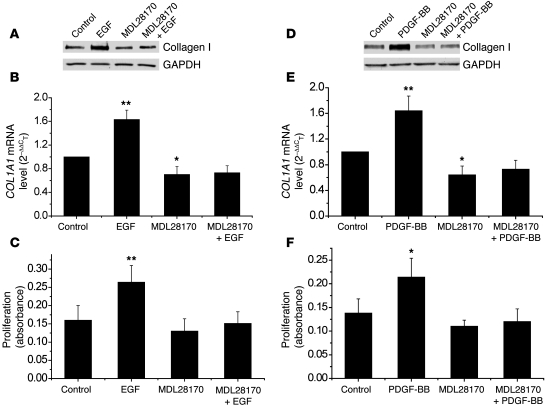
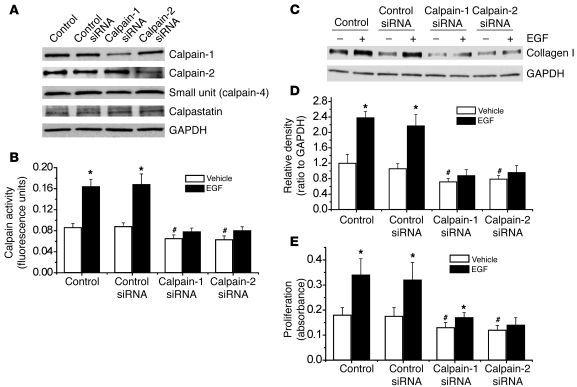
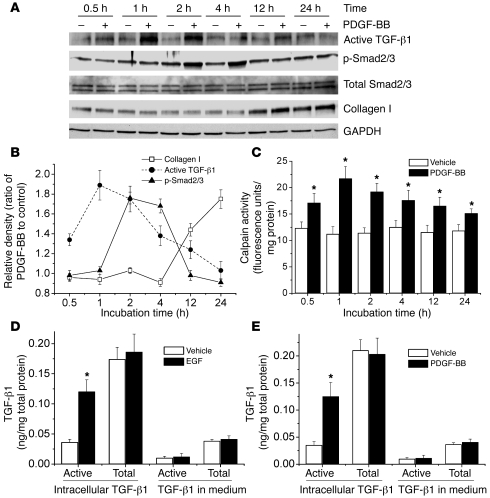
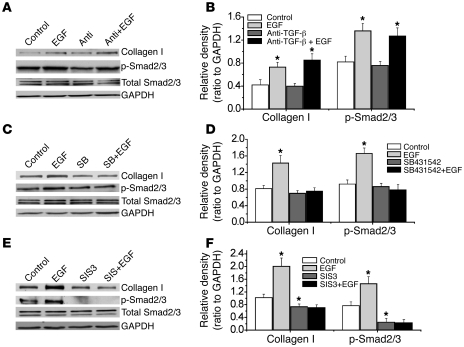
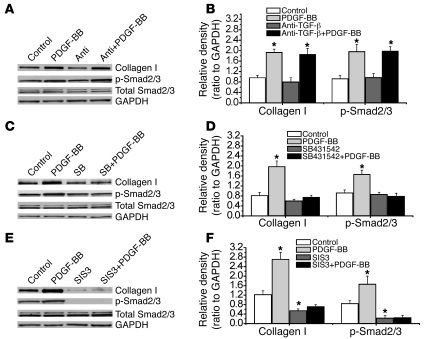
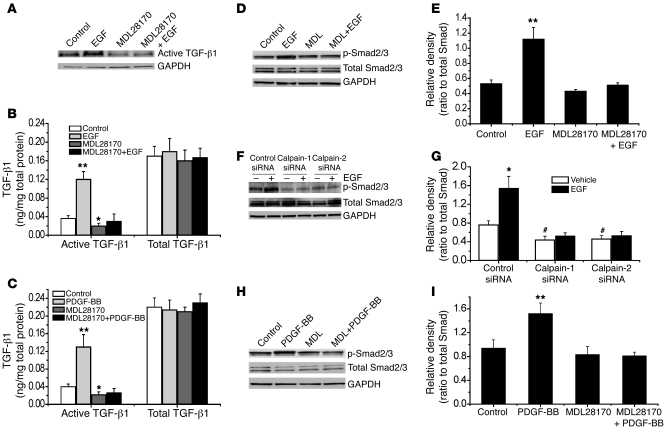
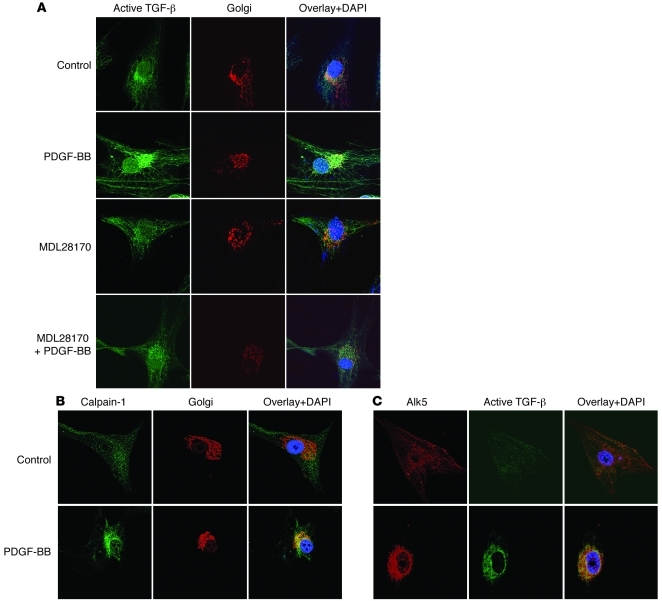
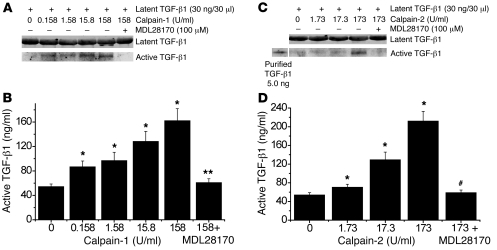
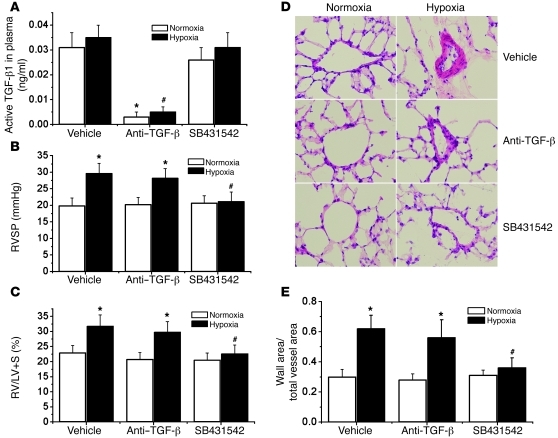
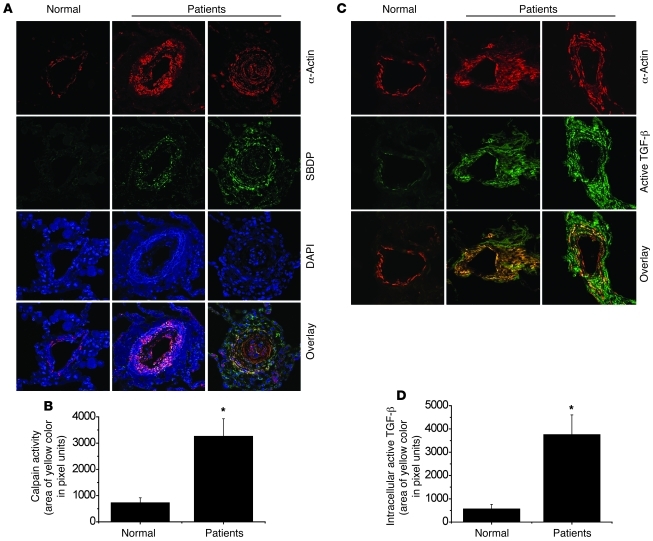
Pulmonary hypertension is a severe and progressive disease, a key feature of which is pulmonary vascular remodeling. Several growth factors, including EGF, PDGF, and TGF-β1, are involved in pulmonary vascular remodeling during pulmonary hypertension. However, increased knowledge of the downstream signaling cascades is needed if effective clinical interventions are to be developed. In this context, calpain provides an interesting candidate therapeutic target, since it is activated by EGF and PDGF and has been reported to activate TGF-β1. Thus, in this study, we examined the role of calpain in pulmonary vascular remodeling in two rodent models of pulmonary hypertension. These data showed that attenuated calpain activity in calpain-knockout mice or rats treated with a calpain inhibitor resulted in prevention of increased right ventricular systolic pressure, right ventricular hypertrophy, as well as collagen deposition and thickening of pulmonary arterioles in models of hypoxia- and monocrotaline-induced pulmonary hypertension. Additionally, inhibition of calpain in vitro blocked intracellular activation of TGF-β1, which led to attenuated Smad2/3 phosphorylation and collagen synthesis. Finally, smooth muscle cells of pulmonary arterioles from patients with pulmonary arterial hypertension showed higher levels of calpain activation and intracellular active TGF-β. Our data provide evidence that calpain mediates EGF- and PDGF-induced collagen synthesis and proliferation of pulmonary artery smooth muscle cells via an intracrine TGF-β1 pathway in pulmonary hypertension.


Figures

Figure 1
Figure 1. Protein content of calpain-1, calpain-2, calpain-4, calpastatin, p-Smad2/3, total Smad2/3, and collagen I in the lungs of ER-Cre+/–Capn4fl/fl and control mice exposed to normoxia and chronic hypoxia.
Five days after the regimen of tamoxifen administration, control and ER-Cre+/–Capn4fl/fl mice were exposed to room air (normoxia) or 10% oxygen (hypoxia) for 3 weeks. Then protein content of calpain-1, calpain-2, calpain-4, calpastatin, p-Smad2/3, total Smad2/3, and collagen I in lung homogenates was analyzed using Western blot analysis. (A) Representative immunoblots from 8 experiments. (BD) Changes in calpain-1, calpain-2, calpain-4, calpastatin, spectrin, p-Smad2/3, total Smad2/3, and collagen I quantified by scanning densitometry. Results are expressed as mean ± SEM; n = 8 experiments. *P < 0.05 versus control.
Figure 2
Figure 2. Effects of calpain inhibition by conditional knockout of calpain-4 on SBDP and collagen I in the smooth muscle of pulmonary arterioles of mice with hypoxic pulmonary hypertension.
Five days after tamoxifen administration, control and ER-Cre+/–Capn4fl/fl mice were exposed to room air (normoxia) or 10% oxygen (hypoxia) for 3 weeks. (A) Lung slides from ER-Cre+/–Capn4fl/fl and control mice exposed to normoxia or hypoxia were double stained for α-actin (red) and SBDP (green) and then counterstained for DAPI. (B) Lung slides from ER-Cre+/–Capn4fl/fl and control mice exposed to normoxia or hypoxia were double stained for α-actin (red) and collagen I (green). Images are representative of 8 independent experiments. Original magnification, ×400.
Figure 3
Figure 3. Conditional knockout of calpain-4 attenuates chronic hypoxia–induced pulmonary hypertension and pulmonary vascular remodeling.
Five days after tamoxifen administration, control and ER-Cre+/–Capn4fl/fl mice were exposed to room air (normoxia) or 10% oxygen (hypoxia) for 3 weeks. Then pulmonary hypertension and pulmonary vascular remodeling were assessed. (A) Changes in RVSP. (B) Changes in RV/LV+S. (C) Representative images of lung sections of control and ER-Cre+/–Capn4fl/fl mice exposed to normoxia or hypoxia. Original magnification, ×400. (D) Changes in ratio of wall area to total vessel area in the lung sections of control and ER-Cre+/–Capn4fl/fl mice exposed to normoxia or hypoxia. Results are expressed as mean ± SEM; n = 8 experiments. *P < 0.05 versus normoxia; #P < 0.05 versus hypoxia group of control mice.
Figure 4
Figure 4. The specific calpain inhibitor MDL28170 prevents progression of MCT-induced pulmonary hypertension and pulmonary vascular remodeling in rats.
Male Sprague-Dawley rats 8 weeks of age were injected subcutaneously without or with MCT (60 mg/kg). After 2 weeks, pulmonary hypertension and pulmonary vascular remodeling were determined in control and MCT-injected rats (MCT 2 weeks). At the same time (the beginning of third week), groups of control rats (MDL28170) and MCT-injected rats (MCT 3 wk + MDL28170) began receiving MDL28170 (20 mg/kg, i.p.) once daily. A second group of MCT-injected rats received the same volume of vehicle (MCT 3 wk). Pulmonary hypertension and pulmonary vascular remodeling were assessed 1 week later (3 weeks after MCT injection). (A) Changes in RVSP. (B) Changes in RV/LV+S. (C) Representative images of lung sections of rats. Original magnification, ×400. (D) Changes in ratio of wall area to total vessel area in the lung sections of rats. (E) Protocol for time course of this experiment. Results are expressed as mean ± SEM; n = 6 experiments. *P < 0.05 versus control; **P < 0.05 versus MDL28170; #P < 0.05 versus MCT 2 wk; ##P < 0.05 versus MCT 3 wk.
Figure 5
Figure 5. EGF and PDGF increase calpain activity, collagen synthesis, and cell proliferation in PASMCs.
PASMCs were incubated with EGF and PDGF-BB (3–30 ng/ml) for 1–24 hours, after which calpain activity (A and E), collagen I protein content in the cell lysates and culture medium (B and F), COL1A1 mRNA (C and G), and cell proliferation (D and H) were measured as described in Methods. (B and F) Representative immunoblots from 4 experiments. Results are expressed as mean ± SEM; n = 4 experiments. *P < 0.05, **P < 0.01 versus control (0 ng/ml).
Figure 6
Figure 6. Specific calpain inhibitor MDL28170 inhibits EGF- and PDGF-BB–induced increases in collagen synthesis and cell proliferation of PASMCs.
PASMCs were incubated with EGF (10 ng/ml) and PDGF-BB (10 ng/ml) in the presence and absence of MDL28170 (20 μM) for 24 hours, after which intracellular collagen I protein content (A and D), COL1A1 mRNA (B and E), and cell proliferation (C and F) were measured as described in Methods. (A and D) Representative immunoblots from 4 experiments. Results are expressed as mean ± SEM; n = 4 experiments. *P < 0.05, **P < 0.01 versus control.
Figure 7
Figure 7. Knockdown of calpain-1 and calpain-2 attenuates EGF-induced increases in calpain activity, collagen synthesis, and cell proliferation.
PASMCs were transfected with an siRNA against the mRNA of calpain-1, calpain-2, or control (luciferase) siRNA. After 96 hours, the cells were incubated with EGF (10 ng/ml) for 1–24 hours, and then protein content of calpain-1, calpain-2, small unit (calpain-4), and calpastatin (A); calpain activity (B); intracellular collagen I protein content (C and D); and cell proliferation (E) were measured as described in Methods. (A and C) Representative immunoblots of calpain-1, calpain-2, calpain-4, calpastatin, and collagen I from 4 experiments. (D) Changes in the intracellular collagen I protein content quantified by scanning densitometry. Results are expressed as mean ± SEM; n = 4 experiments. *P < 0.05 versus vehicle (without EGF); #P < 0.05 versus vehicle (without EGF) in control siRNA.
Figure 8
Figure 8. EGF and PDGF-BB induce increases in intracellular active TGF-β1 and phosphorylation of Smad2/3 in PASMCs.
(A) Representative immunoblots of intracellular active TGF-β1, p-Smad2/3, total Smad2/3, and collagen I in the lysates of PASMCs incubated with or without PDGF-BB (10 ng/ml) for 0.5–24 hours. (B) Changes in intracellular active TGF-β1, p-Smad2/3, and collagen I protein content quantified by scanning densitometry. (C) Time-dependent changes in calpain activity in PASMCs incubated with or without PDGF-BB (10 ng/ml) for 0.5–24 hours. (D) ELISA assay of the content of active TGF-β1 and total TGF-β1 in the lysates and medium of PASMCs incubated with or without EGF (10 ng/ml) for 2 hours. (E) ELISA assay of the content of active TGF-β1 and total TGF-β1 in the lysates and medium of PASMCs incubated with or without PDGF-BB (10 ng/ml) for 2 hours. Results are expressed as mean ± SEM; n = 4 experiments. *P < 0.05 versus vehicle (without EGF or PDGF).
Figure 9
Figure 9. Effects of anti–TGF-β neutralizing antibody, the TGF-β1 receptor inhibitor SB431542, and the Smad2/3 inhibitor SIS3 on EGF-induced phosphorylation of Smad2/3 and intracellular collagen I protein content in PASMCs.
PASMCs were incubated with EGF (AF, 10 ng/ml) in the presence and absence of anti–TGF-β neutralizing antibody (1 μg/ml), SB431542 (10 μM), and SIS3 (10 μM) for 4 hours (p-Smad2/3, total Smad2/3), or 24 hours (collagen I protein), after which p-Smad2/3, total Smad2/3, and collagen I protein were measured using Western blot analysis. (A, C, and E) Representative immunoblots of 4 experiments. (B, D, and F) Changes in p-Smad2/3 and collagen I protein content quantified by scanning densitometry. Results are expressed as mean ± SEM; n = 4 experiments. *P < 0.05 versus vehicle (without EGF). Anti, anti–TGF-β neutralizing antibody; SB, SB431542.
Figure 10
Figure 10. Effects of anti–TGF-β neutralizing antibody, the TGF-β1 receptor inhibitor SB431542, and the Smad2/3 inhibitor SIS3 on PDGF-BB–induced phosphorylation of Smad2/3 and intracellular collagen I protein content in PASMCs.
PASMCs were incubated with PDGF-BB (AF, 10 ng/ml) in the presence and absence of anti–TGF-β neutralizing antibody (1 μg/ml), SB431542 (10 μM), and SIS3 (10 μM) for 4 hours (p-Smad2/3, total Smad2/3) or 24 hours (collagen I protein), after which p-Smad2/3, total Smad2/3, and collagen I protein were measured using Western blot analysis. (A, C, and E) Representative immunoblots of 4 experiments. (B, D, and F) Changes in p-Smad2/3 and collagen I protein content quantified by scanning densitometry. Results are expressed as mean ± SEM; n = 4 experiments. *P < 0.05 versus control (without PDGF-BB).
Figure 11
Figure 11. Inhibition of calpain blocks EGF- and PDGF-BB–induced increases in intracellular content of active TGF-β1 and p-Smad2/3 in PASMCs.
PASMCs were incubated with EGF (10 ng/ml) or PDGF-BB (10 ng/ml) in the presence and absence of MDL28170 (20 μM) for 2 hours, after which the intracellular content of active TGF-β1 (A) and p-Smad2/3 (D, E, H, and I) was measured using Western blot analysis; intracellular active TGF-β1 content was also assayed using ELISA (B and C). (F and G) PASMCs were transfected with an siRNA against the mRNA of calpain-1 or calpain-2 or control (luciferase) siRNA. After 96 hours, the cells were incubated with EGF (10 ng/ml) for 2 hours, and then the protein content of p-Smad2/3 and total Smad2/3 was measured using immunoblotting. (A, D, F, and H) Representative immunoblots from 4 experiments. (E, G, and I) Changes in p-Smad2/3 and total Smad2/3 content quantified by scanning densitometry. Results are expressed as mean ± SEM; n = 4 experiments. *P < 0.05, **P < 0.01 versus control (without EGF or PDGF-BB). #P < 0.05 versus vehicle group in control siRNA. MDL, MDL28170.
Figure 12
Figure 12. Colocalization of active TGF-β, Alk5, and calpain in the Golgi.
(A) After treatment with or without the calpain inhibitor MDL28170 (20 μM) for 30 minutes, PASMCs were incubated with PDGF-BB (10 ng/ml) for another 30 minutes. Then the cells were double stained for Golgi (red) and active TGF-β (green) and counterstained by using DAPI (blue). (B and C) PASMCs were incubated with PDGF-BB (10 ng/ml) for 30 minutes and then double stained for Golgi (red) and calpain-1 (green) or Alk5 (red) and active TGF-β (green) and counterstained with DAPI (blue). Images are representative of 3 experiments. Original magnification, ×400.
Figure 13
Figure 13. Calpain-1 and -2 activate latent TGF-β1 in vitro.
(A and C) Purified latent TGF-β1 (30 ng/30 μl) was incubated with calpain-1 (0–158 U/ml) or calpain-2 (0–173 U/ml) in the presence of 5 mM calcium overnight at room temperature, after which the mixtures were subjected to Western blot analysis in non-denaturing and non-reducing conditions. (B and D) Active TGF-β1 in the mixture was also assayed using ELISA. Results are expressed as mean ± SEM; n = 3 experiments. *P < 0.05 versus control (zero); **P < 0.05 versus calpain-1 158 U/ml group; #P < 0.05 versus calpain-2 173 U/ml group.
Figure 14
Figure 14. Effects of neutralizing anti–TGF-β antibody and Alk5 inhibitor SB431542 on chronic hypoxia–induced pulmonary hypertension and pulmonary vascular remodeling.
Mice were exposed to room air (normoxia) or 10% oxygen (hypoxia). At the beginning of second week, groups of normoxic and hypoxic mice were injected with neutralizing anti–TGF-β antibody (10 mg/kg, i.p., twice a week) or SB431542 (4.2 mg/kg, i.p., daily). Three weeks after hypoxia, plasma TGF-β1 levels, pulmonary hypertension, and pulmonary vascular remodeling were assessed. (A) Changes in active TGF-β1 levels in plasma. (B) Changes in RVSP. (C) Changes in RV/LV+S. (D) Representative images of lung sections of normoxic or hypoxic mice with or without neutralizing anti–TGF-β antibody and SB431542. Original magnification, ×400. (E) Changes in ratio of wall area to total vessel area in the lung sections. Results are expressed as mean ± SEM; n = 6. *P < 0.05 versus normoxia; #P < 0.05 versus hypoxia group with vehicle.
Figure 15
Figure 15. Levels of calpain activation and active TGF-β in smooth muscle cells of muscular pulmonary arteries of patients with pulmonary arterial hypertension.
(A and C) Higher level of calpain activation and active TGF-β in smooth muscle of pulmonary arterioles of patients with pulmonary arterial hypertension. Human lung slides were double stained for α-actin (red), SBDP (green), or active TGF-β (green) and counterstained by using DAPI (blue). Images are representative of lung tissues from patients with idiopathic pulmonary arterial hypertension (n = 6) and normal lungs (n = 5). Original magnification, ×400. (B and D) Changes in calpain activity and intracellular active TGF-β in smooth muscle of pulmonary arterioles. *P < 0.05 versus normal. Results are expressed as mean ± SEM.

Similar articles

Cited by

References

    1. Tuder RM. Pathology of pulmonary arterial hypertension. Semin Respir Crit Care Med. 2009;30(4):376–385. - PubMed
    1. Rabinovitch M. Molecular pathogenesis of pulmonary arterial hypertension. J Clin Invest. 2008;118(7):2372–2379. doi: 10.1172/JCI33452. - DOI - PMC - PubMed
    1. Stenmark KR, Meyrick B, Galie N, Mooi WJ, McMurtry IF. Animal models of pulmonary arterial hypertension: the hope for etiological discovery and pharmacological cure. Am J Physiol Lung Cell Mol Physiol. 2009;297(6):L1013–L1032. doi: 10.1152/ajplung.00217.2009. - DOI - PubMed
    1. Rabinovitch M. Pathobiology of pulmonary hypertension. Annu Rev Pathol. 2007;2:369–399. doi: 10.1146/annurev.pathol.2.010506.092033. - DOI - PubMed
    1. Hassoun PM, et al. Inflammation, growth factors, and pulmonary vascular remodeling. J Am Coll Cardiol. 2009;54(1 suppl):S10–S19. doi: 10.1016/j.jacc.2009.04.006. - DOI - PubMed

Publication types

MeSH terms