. 2012 Jan 7;137(1):87-97.
doi: 10.1039/c1an15658f. Epub 2011 Oct 18.

Design and development of a field-deployable single-molecule detector (SMD) for the analysis of molecular markers

Affiliations

Design and development of a field-deployable single-molecule detector (SMD) for the analysis of molecular markers

Jason M Emory et al. Analyst. .

Abstract

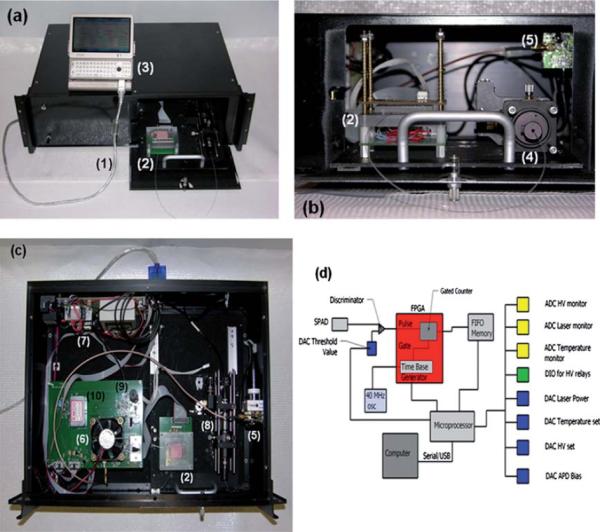
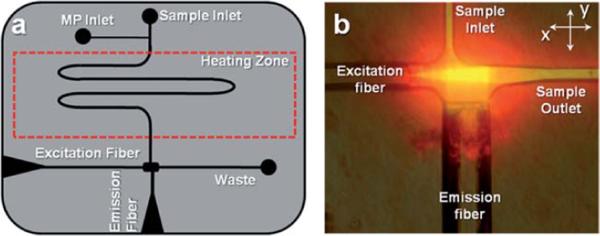
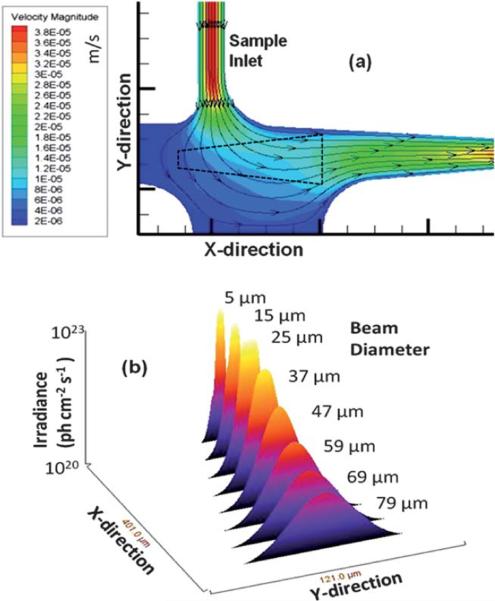
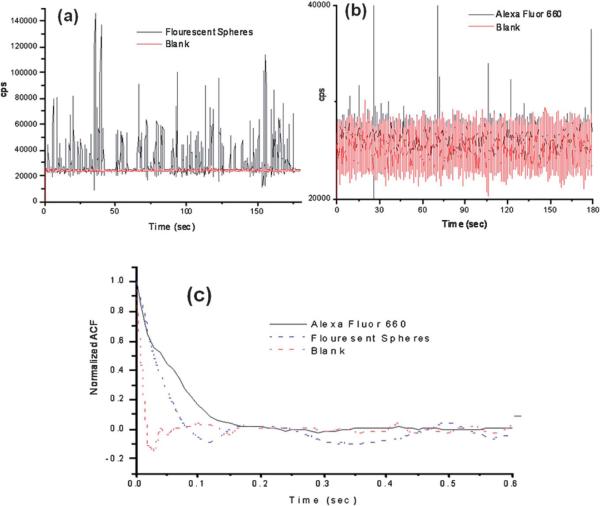
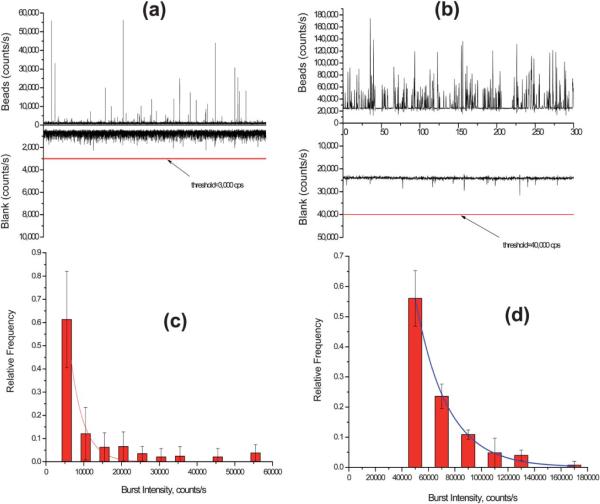
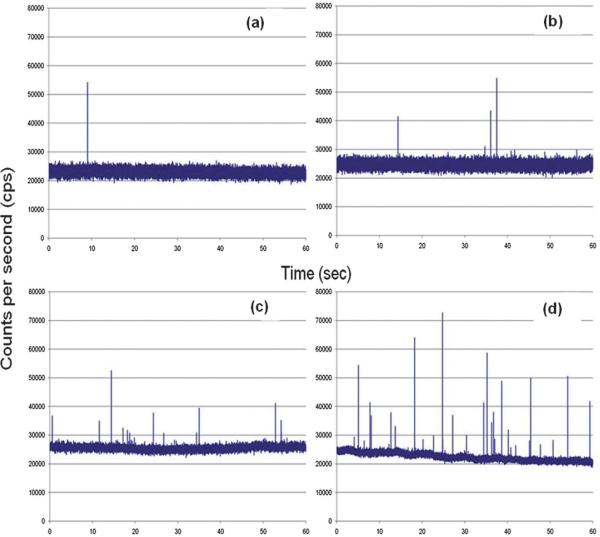
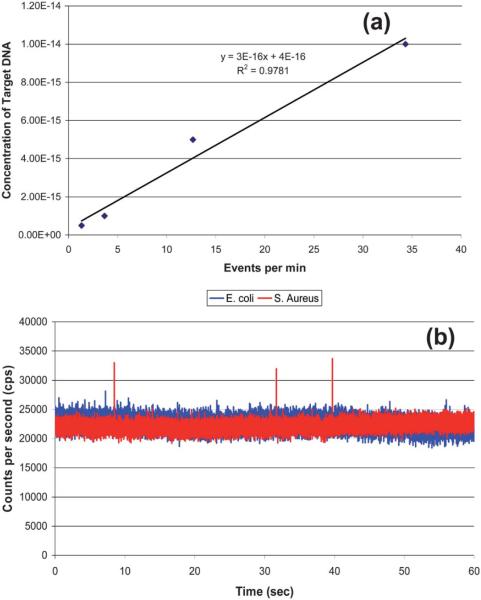
Single-molecule detection (SMD) has demonstrated some attractive benefits for many types of biomolecular analyses including enhanced processing speed by eliminating processing steps, elimination of ensemble averaging and single-molecule sensitivity. However, it's wide spread use has been hampered by the complex instrumentation required for its implementation when using fluorescence as the readout modality. We report herein a simple and compact fluorescence single-molecule instrument that is straightforward to operate and consisted of fiber optics directly coupled to a microfluidic device. The integrated fiber optics served as waveguides to deliver the laser excitation light to the sample and collecting the resulting emission, simplifying the optical requirements associated with traditional SMD instruments by eliminating the need for optical alignment and simplification of the optical train. Additionally, the use of a vertical cavity surface emitting laser and a single photon avalanche diode serving as the excitation source and photon transducer, respectively, as well as a field programmable gate array (FPGA) integrated into the processing electronics assisted in reducing the instrument footprint. This small footprint SMD platform was tested using fluorescent microspheres and single AlexaFluor 660 molecules to determine the optimal operating parameters and system performance. As a demonstration of the utility of this instrument for biomolecular analyses, molecular beacons (MBs) were designed to probe bacterial cells for the gene encoding Gram-positive species. The ability to monitor biomarkers using this simple and portable instrument will have a number of important applications, such as strain-specific detection of pathogenic bacteria or the molecular diagnosis of diseases requiring rapid turn-around-times directly at the point-of-use.


Figures

Fig. 1
Fig. 1
(a) Picture of the compact SMD instrument connected to a mini-computer for data collection and instrument control. (b) Access panel for loading sample into the microfluidic chip and connecting the collection fiber optic to the fiber U-bench, which contained optical fibers and another optical fiber interfaced to the SPAD. (c) Inside the compact SMD instrument showing the arrangement of the VCSEL, SPAD, FPGA and other peripheral electronics. (d) Schematic of the FPGA that was used for data acquisition and single-photon processing. The FPGA counted signals from the SPAD and output information to the first-in first-out (FIFO) memory. (1)–USB interface cable to the controlling computer; (2)–microfluidic chip sitting atop a mounting stage, which is accessed through a drawer that slides out from the main instrument case; (3)–controlling computer; (4)–fiber bench with optical cable connected to the fluidic chip; (5)–SPAD with integrated fiber optic; (6)–cooling fan for the FPGA, which is located underneath this fan; (7)–various power supplies; (8)–fiber bench with optical filters; (9)–VCSEL with integrated fiber; and (10)–electrophoresis power supply to actuate fluids electronkinetically.
Fig. 2
Fig. 2
(a) Design of the polymer-based microfluidic chip with integrated fiber optics for delivering excitation light to the chip and collecting the resulting emission. The fibers were placed in guide channels embossed into the chip to allow exact placement during chip assembly and were oriented at 90° with respect to each other. The chip also contained a backside heater to control the temperature for hybridization-based assays. (b) Fluorescence image of the field-of-view of the excitation and emission fibers showing the intersection of the optical paths, which defined the probe volume that was determined to be 98 pL. The chip was filled with Alexa Fluor 660 dye to generate the necessary image.
Fig. 3
Fig. 3
(a) Simulation of the flow velocities and flow vectors of the fluid as it moved from the input channel into the detection zone (units are m s−1). The simulation was run using Fluent software with quad element meshing and 80,000 nodes performed in Gambit. An outline of the probe volume as determined from Fig. 2(b) is shown as well (black dotted line). (b) 3D surface plot of the detection zone versus the irradiance experienced by single fluorescent entities as they traverse through the probe volume. The irradiance decreased as the beam expanded and thus, single fluorescent entities traveling along the edges of the Gaussian intensity profile show reduced photon fluxes.
Fig. 4
Fig. 4
Photon burst data collected using the compact, field-deployable SMD instrument. The red trace shows the blank and the black trace is the data with fluorescent beads or dye seeded into the buffer. (a) Plot of photon bursts generated from fluorescent microspheres. (b) Single AlexaFluor 660 dye molecule burst data. (c) Autocorrelation analysis was performed on the blank, fluorescent spheres and AlexaFluor 660 dye molecule solutions. The fluorescent microspheres and the AlexaFluor dye molecules showed transit times of 49 ms and 53 ms, respectively, using the same flow rate.
Fig. 5
Fig. 5
(a) Trace data of photon bursts detected using a confocal LIF setup for the fluorescent spheres. A threshold level of 3,000 cps was set to discriminate true single particle events from background fluorescence fluctuations. (b) Trace data of photon bursts detected using the compact SMD instrument for the fluorescent spheres. In this case, a threshold level of 40,000 cps was set to discriminate single particle events from background fluorescence fluctuations. (c) Histogram of photon burst intensities constructed from the data set in (a) using the confocal LIF setup. The accepted photon bursts were compiled into bins of 5,000 cps. (d) Histogram of photon burst intensities from data in (c) using the compact SMD instrument. The data in this case were accumulated into bins of 20,000 cps.
Fig. 6
Fig. 6
Complementary DNA was mixed with 0.5 nM of the MBs and pumped through the microfluidic chip at 0.01 mL/h. The target concentrations used in this case were; (a) 5.0 × 10⁻¹⁶ M; (b) 1.0 × 10⁻¹⁵ M; (c) 5.0 × 10⁻¹⁵ M; and (d) 1.0 × 10⁻¹⁴ M.
Fig. 7
Fig. 7
(a) Calibration curve generated from the data shown in Fig. 6. The data points were fit to a linear function, y = 3 × 10¹⁵ x − 0.9291, with R2 = 0.97. (b) rDNAextracted from 2,000 S. aureus cells (Gram (+)) and mixed with the 0.5 nM MB solution. As a control, DNA from E. coli (Gram(−)) was extracted and mixed with the MB solution as well. The S. aureus showed 3 events above the discrimination level whereas the E. coli showed no events above this level.

Similar articles

Cited by

References

    1. Gell C, Sabir T, Westwood J, Rashid A, Smith DAM, Harris SA, Stockley PG. J. Mol. Biol. 2008;384:264–278. - PubMed
    1. Haupts U, Rudiger M, Ashman S, Turconi S, Bingham R, Wharton C, Hutchinson J, Carey C, Moore KJ, Pope AJ. J. Biomol. Screening. 2003;8:19–33. - PubMed
    1. Hintersteiner M, Auer M. In: Fluorescence Methods and Applications: Spectroscopy, Imaging, and Probes. Wolfbeis OS, editor. vol. 1130. 2008. pp. 1–11.
    1. Kang SH, Kim YJ, Yeung ES. Anal. Bioanal. Chem. 2007;387:2663–2671. - PubMed
    1. Moore KJ, Turconi S, Ashman S, Ruediger M, Haupts U, Emerick V, Pope AJ. J. Biomol. Screening. 1999;4:335–353. - PubMed

Publication types

MeSH terms

LinkOut - more resources