. 2011 Dec 1;589(Pt 23):5879-95.
doi: 10.1113/jphysiol.2011.220533. Epub 2011 Oct 17.

Trigeminal ganglion neuron subtype-specific alterations of Ca(V)2.1 calcium current and excitability in a Cacna1a mouse model of migraine

Affiliations

Trigeminal ganglion neuron subtype-specific alterations of Ca(V)2.1 calcium current and excitability in a Cacna1a mouse model of migraine

B Fioretti et al. J Physiol. .

Abstract

Familial hemiplegic migraine type-1 (FHM1), a monogenic subtype of migraine with aura, is caused by gain-of-function mutations in Ca(V)2.1 (P/Q-type) calcium channels. The consequences of FHM1 mutations on the trigeminovascular pathway that generates migraine headache remain largely unexplored. Here we studied the calcium currents and excitability properties of two subpopulations of small-diameter trigeminal ganglion (TG) neurons from adult wild-type (WT) and R192Q FHM1 knockin (KI) mice: capsaicin-sensitive neurons without T-type calcium currents (CS) and capsaicin-insensitive neurons characterized by the expression of T-type calcium currents (CI-T). Small TG neurons retrogradely labelled from the dura are mostly CS neurons, while CI-T neurons were not present in the labelled population. CS and CI-T neurons express Ca(V)2.1 channels with different activation properties, and the Ca(V)2.1 channels are differently affected by the FHM1 mutation in the two TG neuron subtypes. In CI-T neurons from FHM1 KI mice there was a larger P/Q-type current density following mild depolarizations, a larger action potential (AP)-evoked calcium current and a longer AP duration when compared to CI-T neurons from WT mice. In striking contrast, the P/Q-type current density, voltage dependence and kinetics were not altered by the FHM1 mutation in CS neurons. The excitability properties of mutant CS neurons were also unaltered. Congruently, the FHM1 mutation did not alter depolarization-evoked CGRP release from the dura mater, while CGRP release from the trigeminal ganglion was larger in KI compared to WT mice. Our findings suggest that the facilitation of peripheral mechanisms of CGRP action, such as dural vasodilatation and nociceptor sensitization at the meninges, does not contribute to the generation of headache in FHM1.


Figures

Figure 2
Figure 2. P/Q-type calcium currents in CS and CI-T trigeminal ganglion neurons
A, peak whole-cell Ca2+ currentvs. time recorded from a CS neuron at –12 mV (every 30 s from a holding potential of –72 mV) during a typical experiment carried out to dissect pharmacologically the N- and P/Q-type Ca2+ current components. Bars indicate the time periods during which nimodipine, ω-conotoxin GVIA (GVIA) and ω-conotoxin MVIIC (MVIIC) were applied. The labelI–Vindicates the time point at which a family of 50 ms pulses in the range –62 mV to +18 mV was applied. Inset on the left: representative current traces at timesa, bandc; on the right: N- and P/Q-type Ca2+ current traces obtained as the difference between traces at timesaandb, andbandc, respectively. Cell WT6D.B, percentage of nimodipine-insensitive Ca2+ current inhibited by GVIA (N-type), MVIIC (P/Q-type) and remaining in the presence of MVIIC (R-type) in CS and CI-T neurons.C, average normalized total nimodipine-insensitive Ca2+ current as a function of voltage in CS (n = 8) and CI-T (n = 13) neurons (obtained in cells with voltage error ≤10 mV). Dotted lines are fits of equation:I = Gmax(VErev){1+exp[(V1/2V)/k]}−1 withV1/2 = –12.0 ± 0.4 mV (k = 5.6 ± 0.2 mV) for CS neurons andV1/2 = –16.7 ± 0.2 mV (k = 5.7 ± 0.1 mV) for CI-T neurons. Experimental points for CI-T neurons were fitted atV≥–22 mV.D, average normalized P/Q-type Ca2+ current as a function of voltage in CS (n = 12) and CI-T (n = 13) neurons (obtained in cells with voltage error ≤5 mV). Dotted lines are fits withV1/2 = –16.5 ± 0.3 mV (k = 5.4 ± 0.2 mV) for CS neurons andV1/2 = –19.8 ± 0.3 mV (k = 5.1 ± 0.2 mV) for CI-T neurons. Experimental points for CI-T neurons were fitted atV≥–32 mV. The hint of a shoulder at low voltages in theI–Vof CI-T neurons is a consequence of a small rundown of the R-type (and possibly residual slow LVA) calcium current and the fact that the P/Q current is obtained as difference current. Inset: pooled P/Q-type Ca2+ current traces at –12 mV obtained by pharmacological subtraction in CS (black) and CI-T (grey) neurons. Mean capacitance of CS and CI-T neurons: 11 ± 1 pF (n = 12) and 12 ± 1 pF (n = 13), respectively.
Figure 1
Figure 1. Sensitivity to capsaicin and presence of LVA calcium currents distinguish three subgroups of small trigeminal ganglion neurons
A, small-diameter TG neurons (C≤ 20 pF) were subclassified into three subgroups, based on the sensitivity to capsaicin and the presence of a LVA (T-type) calcium current: capsaicin-sensitive, T-type negative (CS) neurons, capsaicin-insensitive, T-type positive (CI-T) neurons, and capsaicin-insensitive, T-type negative (CI) neurons.Aalso shows a chart histogram with the frequency of occurrence of the three neuronal subgroups.B, top: LVA calcium current at –52 mV in a representative CI-T neuron in control (tracea) and in the presence of 20 μm Ni2+ (traceb), 50 μm Ni2+ (tracec) and 100 μm Ni2+ (traced). The corresponding normalized current tracesa, bandd, together with the normalized difference trace (a – brepresenting the LVA current inhibited by 20 μm Ni2+) are shown on the bottom. The time course of inactivation of the latter current (tracea – b) was best fitted by a single exponential with time constant of 12 ms, whereas that of the total LVA current (tracea) required two exponentials with time constants of 14 ms (82%) and 79 ms (18%). The residual current in the presence of 100 μm Ni2+ (traced) could be well fitted with the same components by increasing the fraction of the slow component from 18 to 70%. 95% of the peak current (T95) was reached after 8.1, 8.9 and 13 ms for the Ni2+-sensitive (tracea – b), total LVA (tracea) and residual (traced) currents, respectively. Cell T16D.C, Ca2+ current as a function of voltage and corresponding Ca2+ current traces at –82, –72, –62, –52 and –42 mV of a CI-T neuron with a largely prevailing fast LVA current component. The time course of inactivation during 136 ms pulses at –52 mV was best fitted by two exponentials with time constants of 13 ms (88%) and 94 ms (12%). T95 = 6 ms. Cell T16I.D, Ca2+ current as a function of voltage and corresponding Ca2+ current traces of a CI-T neuron with a largely prevailing slow LVA current component. The time course of inactivation at –52 mV was best fitted by a single exponential with time constant of 68 ms and a constant component of 43 pA, that possibly represents a small R-type Ca2+ current; the best fit required such a small constant value in most neurons with prevailing slow LVA and in some neurons with prevailing fast LVA current. T95 = 22 ms. Right inset: LVA Ca2+ current at –52 mV in control (tracea) and in the presence of 100 μm Cd2+ (traceb). The time course of inactivation of the residual current in the presence of 100 μm Cd2+ was best fitted by a single exponential with time constant of 103 ms. Cell T10A.
Figure 3
Figure 3. The FHM1 mutation does not significantly affect the P/Q-type calcium current in CS trigeminal ganglion neurons from R192Q KI mice
A, average P/Q-type Ca2+ current density as a function of voltage in CS neurons from WT and R192Q KI mice obtained by using the pharmacological protocol illustrated in Fig. 2A. Average normalizedI–Vcurves (obtained in cells with voltage error ≤5 mV: WT, n = 12, KI, n = 14) were multiplied by the average maximal current densities from all cells (n = 15 for both WT and KI). Continuous lines are fits (as in Fig. 2) withV1/2 = –16.5 ± 0.3 mV (k = 5.4 ± 0.2 mV) for WT neurons andV1/2 = –18.0 ± 0.3 mV (k = 5.7 ± 0.2 mV) for KI neurons. Insets: pooled P/Q-type Ca2+ current traces at –32, –22 and –12 mV obtained by pharmacological subtraction in WT (black) and KI (red) CS neurons. Mean capacitance of WT and KI CS neurons: 11 ± 1 pF (n = 15) and 10 ± 1 pF (n = 15), respectively.B, top: action potential waveform elicited by suprathreshold stimulation in a WT CS neuron; bottom: average P/Q-type Ca2+ current densities in response to the action potential used as voltage stimulus in CS neurons from WT and R192Q KI mice. Action potential-evoked P/Q-type current was obtained as difference current before and after MVIIC (see Fig. 2A); the average normalized P/Q currents (obtained in cells with voltage error ≤5 mV: WT, n = 6, KI, n = 7) were multiplied by the average maximal current densities from all cells (n = 9 for both WT and KI).
Figure 4
Figure 4. Selective gain of function of P/Q-type calcium current in CI-T trigeminal ganglion neurons from R192Q KI mice
A, average P/Q-type Ca2+ current density as a function of voltage in CI-T neurons from WT and R192Q KI mice obtained by using the pharmacological protocol illustrated in Fig. 2A. Average normalizedI–Vcurves (obtained in cells with voltage error ≤5 mV: WT, n = 13; KI, n = 8) were multiplied by the average maximal current densities from all cells (WT, n = 15; KI, n = 12). Dotted lines are fits (as in Fig. 2) withV1/2 = –19.8 ± 0.3 mV (k = 5.1 ± 0.2 mV) for WT neurons andV1/2 = –24 ± 0.3 mV (k = 4.5 ± 0.2 mV) for KI neurons. Insets: pooled P/Q-type Ca2+ current traces at –32, –22 and –12 mV obtained by pharmacological subtraction in WT (black) and KI (red) CI-T neurons. Mean capacitance of WT and KI CI-T neurons: 12±1 pF (n = 15) and 11 ± 1 pF (n = 12), respectively.B, average action potential-evoked P/Q-type Ca2+ current densities in CI-T neurons from WT and R192Q KI mice, obtained as in Fig. 3B. The average normalized P/Q currents (obtained in cells with voltage error ≤5 mV: WT, n = 10, KI, n = 8) were multiplied by the average maximal current densities from all cells (WT, n = 15; KI, n = 12).
Figure 5
Figure 5. Excitability properties of CI-T and CS trigeminal ganglion neurons
A, the presence of a slow rebound depolarization (RDP) under physiological ionic conditions correlates with the presence of a LVA Ca2+ current. The presence of a RDP was verified at the beginning of the experiment by applying, under current-clamp mode, a 500 ms hyperpolarizing current able to bring the membrane potential close to –80 mV (representative traces for a CI-T and CS neuron are shown on the left); then the cell was perfused with a solution in which Na+ and Ca2+ ions were replaced by TEA+ and Ba2+ ions and Ca2+ currents were measured in voltage clamp in response to depolarizing pulses preceded by 500 ms prepulses to –100 mV from a holding potential of –60 mV (right traces: Ca2+ current recorded at –50 mV). Cells TR170506E5 and TR120506E6.B, chart histogram with the frequency of occurrence of capsaicin-insensitive neurons with slow RDP (CI-T), capsaicin-sensitive neurons without slow RDP (CS) and capsaicin-insensitive neurons without slow RDP (CI). The sensitivity to capsaicin was verified at the end of the experiment, under voltage clamp at a holding potential of –60 mV, by extracellular application of 1 μm capsaicin.C, left: typical voltage responses evoked by applying short (1 ms) and long (500 ms) depolarizing current pulses at 1.5–2× rheoL in WT CI-T and CS neurons. Cells TR190506E4 and TR230207E1. Right: mean AP repolarizing time (APRT), afterhyperpolarization amplitude (AHPAMPL), rheoS and rheoL for CI-T (n = 51) and CS (n = 38) neurons. All these parameters were found significantly different (P< 0.05) between CI-T and CS neurons. Mean capacitance of CI-T and CS neurons: 11 ± 0.3 pF (n = 51) and 10 ± 0.5 pF (n = 38), respectively.
Figure 6
Figure 6. Action potentials are prolonged in CI-T trigeminal ganglion neurons from R192Q KI mice
A, left: representative superimposed APs upon 1 ms depolarizing pulses for a WT (black) and a KI (red) CI-T neuron. Cells TR160508E6 and TR151008E5. Right: cumulative distributions of the AP repolarizing time (APRT) in WT (n = 21) and KI (n = 22) CI-T neurons.B, left: superimposed first derivatives of the APs shown inA. Right: cumulative distributions of the second minimum rate of repolarization (rr2) in WT (n = 21) and KI (n = 22) CI-T neurons. Mean capacitance of both WT and KI CI-T neurons was 12 ± 0.6 pF.
Figure 7
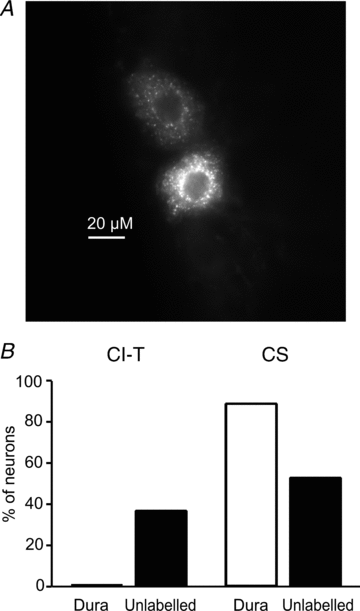
Figure 7. Small trigeminal ganglion neurons retrogradely labelled from the dura do not include CI-T neurons; most are CS neurons
TG neurons were dissociated from wild-type mice in which the fluorescent tracer DiI was previously applied to the dura to label dural afferents. Whole-cell Ca2+ current was recorded from both labelled and unlabelled neurons withC≤ 20 pF. Ca2+ currents were elicited fromVh = –96 mV to test potentials between –66 mV and +54 mV. CI-T neurons were identified on the basis of the presence of LVA Ca2+ current and CS neurons on the basis of capsaicin sensitivity and absence of LVA Ca2+ current.A, image of TG neurons retrogradely labelled from dura from a 16 μm thick slice of a longitudinally sectioned TG. The image was taken using a 40× oil immersion lens.B, fractions of CI-T and CS neurons among small labelled dural and unlabelled TG neurons. The presence of LVA Ca2+ current was tested in 24 labelled dural afferents and 35 unlabelled TG neurons withC≤ 20 pF; 13 of the unlabelled cells were from animals that had surgery but in which DiI was placed in the bone just above the dura. Capsaicin was tested in a fraction of labelled dural (n = 9) and unlabelled (n = 19) TG neurons.
Figure 8
Figure 8. The FHM1 mutation does not significantly affect depolarization-evoked CGRP release from the dura, but it increases depolarization-evoked CGRP release from the trigeminal ganglion
A, left: CGRP released from the dura in hemisected skulls from WT (n = 9) and R192Q KI mice (n = 12) in control solution, after stimulation with 35 mm K+ and after wash. Right: relative stimulation of CGRP release, obtained by dividing the CGRP released in 35 mm K+ by the average of the CGRP released in control and after wash.B, left: CGRP released from intact isolated trigeminal ganglia from WT (n = 16) and R192Q KI mice (n = 10) in control solution, after stimulation with 35 mm K+ and after wash. Right: relative stimulation of CGRP release, obtained as inA.

Comment in

Similar articles

Cited by

References

    1. Adams PJ, Garcia E, David LS, Mulatz KJ, Spacey SD, Snutch TP. CaV2.1 P/Q-type calcium channel alternative splicing affects the functional impact of familial hemiplegic migraine mutations: implications for calcium channelopathies. Channels (Austin) 2009;3:110–121. - PubMed
    1. Akerman S, Kaube H, Goadsby PJ. Anandamide acts as a vasodilator of dural blood vesselsin vivoby activating TRPV1 receptors. Br J Pharmacol. 2004;142:1354–1360. - PMC - PubMed
    1. Akerman S, Williamson DJ, Goadsby PJ. Voltage-dependent calcium channels are involved in neurogenic dural vasodilatation via a presynaptic transmitter release mechanism. Br J Pharmacol. 2003a;140:558–566. - PMC - PubMed
    1. Akerman S, Williamson DJ, Goadsby PJ. Vanilloid type 1 receptors (VR1) on trigeminal sensory nerve fibres play a minor role in neurogenic dural vasodilatation, and are involved in capsaicin-induced dural dilation. Br J Pharmacol. 2003b;140:718–724. - PMC - PubMed
    1. Ayata C. Spreading depression: from serendipity to targeted therapy in migraine prophylaxis. Cephalalgia. 2009;29:1095–1114. - PubMed

Publication types

Substances

Supplementary concepts