

In vitro pharmacodynamics of vancomycin and cefazolin alone and in combination against methicillin-resistant Staphylococcus aureus
- PMID: 22006007
- PMCID: PMC3256059
- DOI: 10.1128/AAC.05473-11
In vitro pharmacodynamics of vancomycin and cefazolin alone and in combination against methicillin-resistant Staphylococcus aureus
Abstract
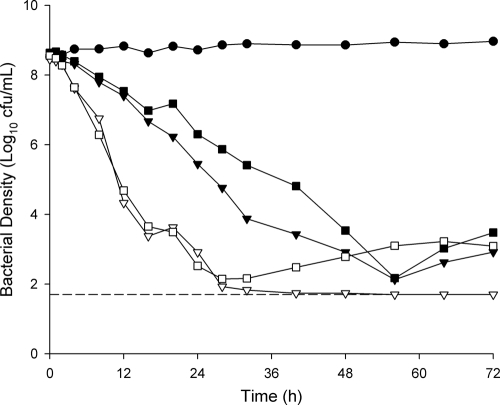
Previous studies employing time-kill methods have observed synergistic effects against methicillin-resistant Staphylococcus aureus (MRSA) when a β-lactam is combined with vancomycin. However, these time-kill studies have neglected the importance of human-simulated exposures. We evaluated the effect of human simulated exposures of vancomycin at 1 g every 8 h (q8h) in combination with cefazolin at 1 g q8h against various MRSA isolates. Four clinical isolates (two MRSA isolates [vancomycin MICs, 0.5 and 2.0 μg/ml], a heterogeneous vancomycin-intermediate S. aureus [hVISA] isolate [MIC, 2.0 μg/ml], and a vancomycin-intermediate S. aureus [VISA] isolate [MIC, 8.0 μg/ml]) were evaluated in an in vitro pharmacodynamic model with a starting inoculum of 10(6) or 10(8) CFU/ml. Bacterial density was measured over 48 to 72 h. Time-kill curves were constructed, and the area under the bacterial killing and regrowth curve (AUBC) was calculated. During 10(6) CFU/ml studies, combination therapy achieved greater log(10) CFU/ml changes than vancomycin alone at 12 h (-4.31 ± 0.58 versus -2.80 ± 0.59, P < 0.001), but not at 48 h. Combination therapy significantly reduced the AUBC from 0 to 48 h (122 ± 14) compared with vancomycin alone (148 ± 22, P = 0.017). Similar results were observed during 10(8) CFU/ml studies, where combination therapy achieved greater log(10) CFU/ml changes at 12 h than vancomycin alone (-4.00 ± 0.20 versus -1.10 ± 0.04, P < 0.001) and significantly reduced the AUBC (275 ± 30 versus 429 ± 37, P < 0.001) after 72 h of incubation. In this study, the combination of vancomycin and cefazolin at human-simulated exposures improved the rate of kill against these MRSA isolates and resulted in greater overall antibacterial effect, but no differences in bacterial density were observed by the end of the experiments.
Figures

Similar articles
-
β-Lactam Combinations with Vancomycin Show Synergistic Activity against Vancomycin-Susceptible Staphylococcus aureus, Vancomycin-Intermediate S. aureus (VISA), and Heterogeneous VISA.Antimicrob Agents Chemother. 2018 May 25;62(6):e00157-18. doi: 10.1128/AAC.00157-18. Print 2018 Jun. Antimicrob Agents Chemother. 2018. PMID: 29555635 Free PMC article.
-
In vitro activity of human-simulated epithelial lining fluid exposures of ceftaroline, ceftriaxone, and vancomycin against methicillin-susceptible and -resistant Staphylococcus aureus.Antimicrob Agents Chemother. 2014 Dec;58(12):7520-6. doi: 10.1128/AAC.03742-14. Epub 2014 Oct 6. Antimicrob Agents Chemother. 2014. PMID: 25288076 Free PMC article.
-
Oritavancin Combinations with β-Lactams against Multidrug-Resistant Staphylococcus aureus and Vancomycin-Resistant Enterococci.Antimicrob Agents Chemother. 2016 Mar 25;60(4):2352-8. doi: 10.1128/AAC.03006-15. Print 2016 Apr. Antimicrob Agents Chemother. 2016. PMID: 26833159 Free PMC article.
-
Pharmacodynamic activity of ceftobiprole compared with vancomycin versus methicillin-resistant Staphylococcus aureus (MRSA), vancomycin-intermediate Staphylococcus aureus (VISA) and vancomycin-resistant Staphylococcus aureus (VRSA) using an in vitro model.J Antimicrob Chemother. 2009 Aug;64(2):364-9. doi: 10.1093/jac/dkp176. Epub 2009 May 19. J Antimicrob Chemother. 2009. PMID: 19454524
-
Use of vancomycin pharmacokinetic-pharmacodynamic properties in the treatment of MRSA infections.Expert Rev Anti Infect Ther. 2010 Jan;8(1):95-106. doi: 10.1586/eri.09.123. Expert Rev Anti Infect Ther. 2010. PMID: 20014904 Free PMC article. Review.
Cited by
-
Bacteriophage AB-SA01 Cocktail in Combination with Antibiotics against MRSA-VISA Strain in an In Vitro Pharmacokinetic/Pharmacodynamic Model.Antimicrob Agents Chemother. 2020 Dec 16;65(1):e01863-20. doi: 10.1128/AAC.01863-20. Print 2020 Dec 16. Antimicrob Agents Chemother. 2020. PMID: 33077648 Free PMC article.
-
Dalbavancin, Vancomycin and Daptomycin Alone and in Combination with Cefazolin against Resistant Phenotypes of Staphylococcus aureus in a Pharmacokinetic/Pharmacodynamic Model.Antibiotics (Basel). 2020 Oct 14;9(10):696. doi: 10.3390/antibiotics9100696. Antibiotics (Basel). 2020. PMID: 33066415 Free PMC article.
-
The Evolving Reduction of Vancomycin and Daptomycin Susceptibility in MRSA-Salvaging the Gold Standards with Combination Therapy.Antibiotics (Basel). 2020 Oct 30;9(11):762. doi: 10.3390/antibiotics9110762. Antibiotics (Basel). 2020. PMID: 33143290 Free PMC article. Review.
-
Ceftaroline increases membrane binding and enhances the activity of daptomycin against daptomycin-nonsusceptible vancomycin-intermediate Staphylococcus aureus in a pharmacokinetic/pharmacodynamic model.Antimicrob Agents Chemother. 2013 Jan;57(1):66-73. doi: 10.1128/AAC.01586-12. Epub 2012 Oct 15. Antimicrob Agents Chemother. 2013. PMID: 23070161 Free PMC article.
-
Monotherapy with Vancomycin or Daptomycin versus Combination Therapy with β-Lactams in the Treatment of Methicillin-Resistant Staphylococcus Aureus Bloodstream Infections: A Retrospective Cohort Analysis.Infect Dis Ther. 2020 Jun;9(2):325-339. doi: 10.1007/s40121-020-00292-8. Epub 2020 Apr 4. Infect Dis Ther. 2020. PMID: 32248513 Free PMC article.
References
-
- Albrecht LM, Rybak MJ, Warbasse LH, Edwards DJ. 1991. Vancomycin protein binding in patients with infections caused by Staphylococcus aureus. DICP 25:713–715 - PubMed
-
- Blaser J. 1985. In-vitro model for simultaneous simulation of the serum kinetics of two drugs with different half-lives. J. Antimicrob. Chemother. 15(Suppl A):125–130 - PubMed
-
- Charles PG, Ward PB, Johnson PD, Howden BP, Grayson ML. 2004. Clinical features associated with bacteremia due to heterogeneous vancomycin-intermediate Staphylococcus aureus. Clin. Infect. Dis. 38:448–451 - PubMed
-
- Clinical and Laboratory Standards Institute 2007. Methods for dilution antimicrobial susceptibility tests for bacteria that grow aerobically; approved standard, 7th ed CLSI document M7-A7, vol 26, no 2 Clinical and Laboratory Standards Institute, Wayne, PA
MeSH terms
Substances
LinkOut - more resources
Full Text Sources
Medical
Miscellaneous
