. 2011 Dec;31(24):4964-77.
doi: 10.1128/MCB.05258-11. Epub 2011 Oct 17.

Global phosphoproteome profiling reveals unanticipated networks responsive to cisplatin treatment of embryonic stem cells

Affiliations

Global phosphoproteome profiling reveals unanticipated networks responsive to cisplatin treatment of embryonic stem cells

Alex Pines et al. Mol Cell Biol. 2011 Dec.

Abstract

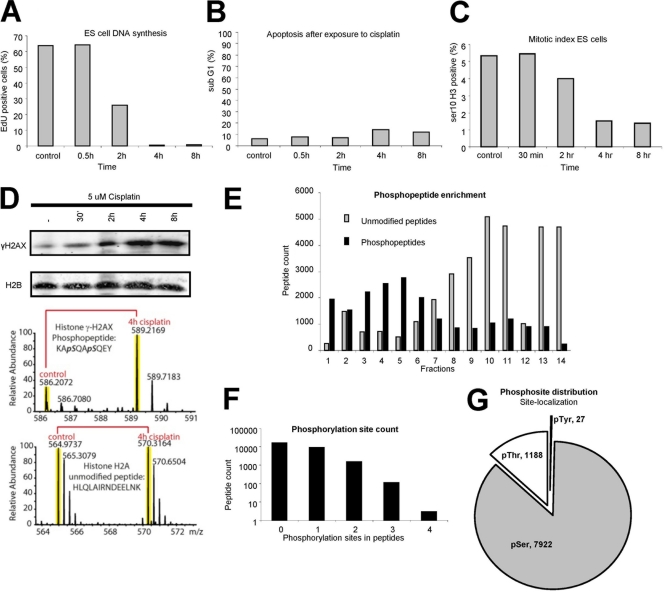
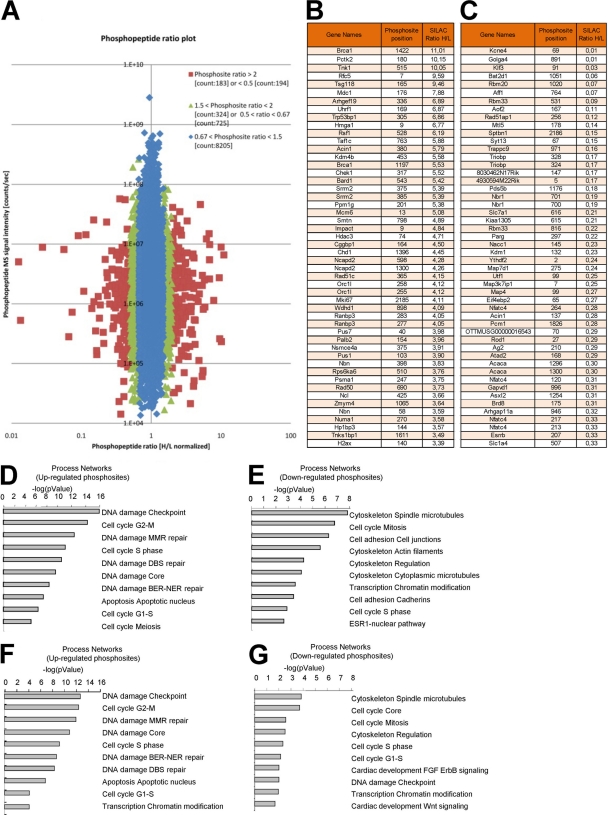
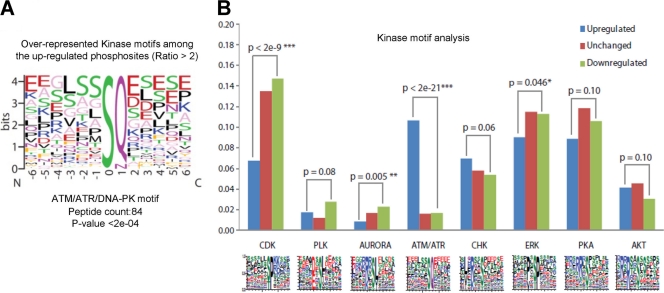
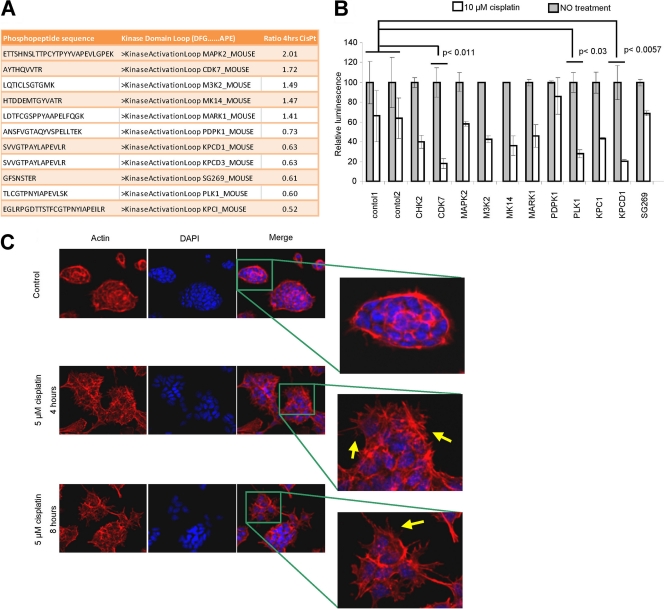
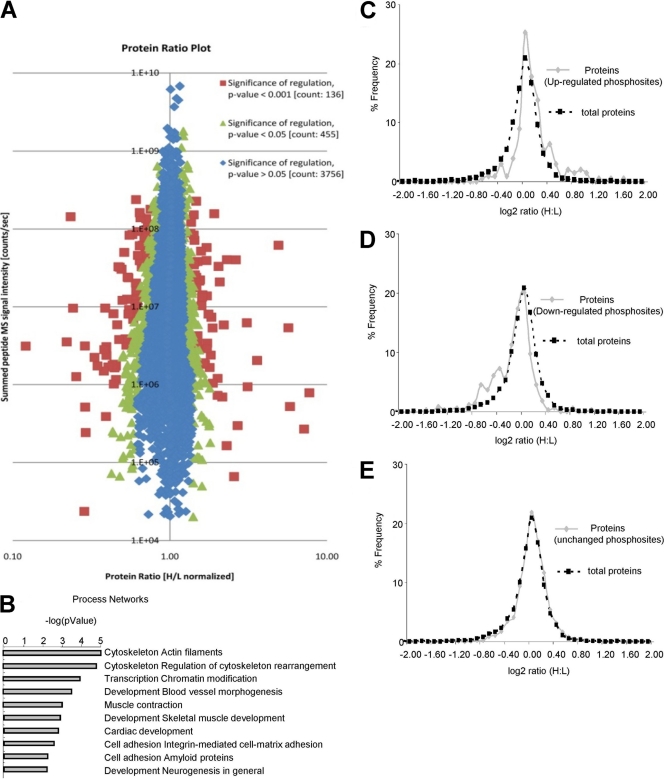
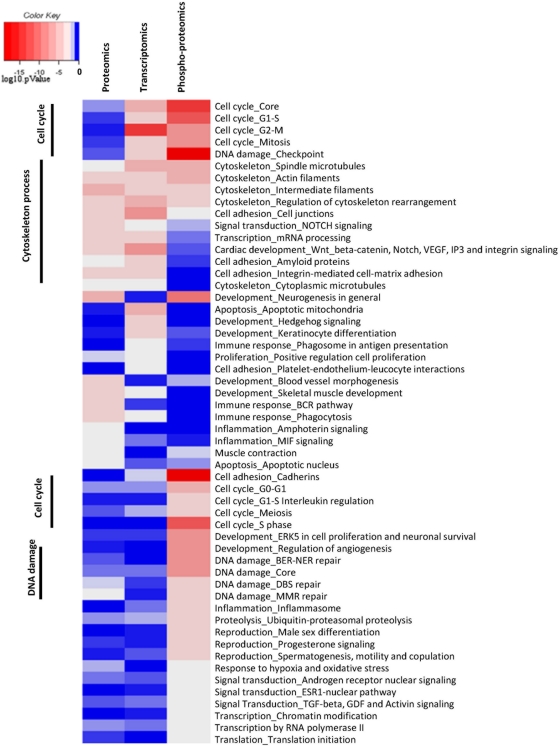
Cellular responses to DNA-damaging agents involve the activation of various DNA damage signaling and transduction pathways. Using quantitative and high-resolution tandem mass spectrometry, we determined global changes in protein level and phosphorylation site profiles following treatment of SILAC (stable isotope labeling by amino acids in cell culture)-labeled murine embryonic stem cells with the anticancer drug cisplatin. Network and pathway analyses indicated that processes related to the DNA damage response and cytoskeleton organization were significantly affected. Although the ATM (ataxia telangiectasia mutated) and ATR (ATM and Rad3-related) consensus sequence (S/T-Q motif) was significantly overrepresented among hyperphosphorylated peptides, about half of the >2-fold-upregulated phosphorylation sites based on the consensus sequence were not direct substrates of ATM and ATR. Eleven protein kinases mainly belonging to the mitogen-activated protein kinase (MAPK) family were identified as being regulated in their kinase domain activation loop. The biological importance of three of these kinases (cyclin-dependent kinase 7 [CDK7], Plk1, and KPCD1) in the protection against cisplatin-induced cytotoxicity was demonstrated by small interfering RNA (siRNA)-mediated knockdown. Our results indicate that the cellular response to cisplatin involves a variety of kinases and phosphatases not only acting in the nucleus but also regulating cytoplasmic targets, resulting in extensive cytoskeletal rearrangements. Integration of transcriptomic and proteomic data revealed a poor correlation between changes in the relative levels of transcripts and their corresponding proteins, but a large overlap in affected pathways at the levels of mRNA, protein, and phosphoprotein. This study provides an integrated view of pathways activated by genotoxic stress and deciphers kinases that play a pivotal role in regulating cellular processes other than the DNA damage response.


Figures

Fig. 1.
Fig. 1.
(A) mES cells were treated with 5 μM cisplatin for different times (as indicated) followed by EdU labeling for 45 min. Flow cytometric analysis evidenced a time-dependent inhibition of DNA synthesis. (B) mES cells were treated with 5 μM cisplatin, and the sub-G1 cell content was determined by flow cytometric analysis at different time points (as indicated). (C) The mitotic index of mES cells treated with 5 μM cisplatin was determined at different time points (as indicated) by flow cytometric analysis. (D) mES cells were treated with 5 μM cisplatin and analyzed 0.5, 2, 4, and 8 h later with the indicated antibodies. −, untreated sample. Shown are the SILAC mass spectrometry spectra of γ-H2AX phosphopeptide and unmodified H2A peptide. (E) Number of phosphopeptides (black bars) and unmodified peptides (gray bars) identified by MS analysis. (F) Number of peptides containing 0, 1, 2, 3, and 4 phosphorylation sites. (G) Phosphorylation site distribution over serine, threonine, and tyrosine residues.
Fig. 2.
Fig. 2.
(A) Phosphopeptide ratio plot. Red dots indicate phosphopeptides that were found to be >2-fold up- or downregulated after cisplatin treatment; green dots indicate phosphopeptides that showed 1.5- to 2-fold up- and downregulation after cisplatin treatment; blue dots indicate phosphopeptides that were not affected by cisplatin treatment. The y axis represents signal intensity of the ions, and it is related to the power (∼amplitude squared) of the signal sine wave. (B) Top 50 upregulated phosphopeptides. (C) Top 50 downregulated phosphopeptides. (D) MetaCore network analysis of proteins containing >1.5-fold-upregulated phosphorylation sites after cisplatin treatment. (E) MetaCore network analysis of proteins containing more than 1.5-fold-downregulated phosphorylation sites after cisplatin treatment. (F) MetaCore network analysis of proteins containing >2-fold-upregulated phosphorylation sites after cisplatin treatment. (G) MetaCore network analysis of proteins containing >2-fold downregulated phosphorylation sites after cisplatin treatment.
Fig. 3.
Fig. 3.
(A) Consensus sequence for ATM, ATR, and DNA-PK substrates among the >2-fold-upregulated phosphorylation sites. (B) Consensus sequence for different kinases among upregulated, downregulated, and unmodified phosphorylation sites.
Fig. 4.
Fig. 4.
(A) Analysis of the kinase domain loop located between the conserved sequence from DFG to APE. (B) The cellular sensitivity for cisplatin after siRNA knockdown was determined by an ATP monitoring system. Knockdown of CDK7, PLK1, or KPCD1 kinases significantly reduced cell survival after cisplatin treatment (Student's t test). siGFP (control 1) and siLAMIN C/A (control 2) were used as negative controls (two independent experiments). (C) Effects of cisplatin on cytoskeleton structure. mES cells were exposed for 4 and 8 h to cisplatin (5 μM) treatment and stained with DY554-phalloidin and DAPI (4′,6-diamidino-2-phenylindole) (nuclei). The arrows indicate microspikes.
Fig. 5.
Fig. 5.
(A) Unmodified peptide ratio plot. Red dots, significantly (P < 0.001) regulated peptides after cisplatin treatment; green dots, significantly (P < 0.05) regulated peptides after cisplatin treatment; blue dots, unmodified peptides after cisplatin treatment. The y axis represents signal intensity of the ions and is related to the power (∼amplitude squared) of the signal sine wave. (B) MetaCore network analysis of significantly affected proteins (P < 0.05) after cisplatin addition. (C) Abundance distributions of all proteins and proteins containing upregulated phosphorylation sites (>1.5-fold) (D) Abundance distributions of all proteins and proteins containing downregulated phosphorylation sites (>1.5-fold). (E) Abundance distributions of all proteins and proteins containing unmodified phosphorylation sites.
Fig. 6.
Fig. 6.
Comparison of significantly affected pathways (MetaCore network analysis) by cisplatin at the transcriptomic (mRNA transcripts; P < 0.05), proteomic (proteins; P < 0.05) and phosphoproteomic (phosphoprotein; P < 0.05) levels.

Similar articles

Cited by

References

    1. Bartek J., Lukas J. 2007. DNA damage checkpoints: from initiation to recovery or adaptation. Curr. Opin. Cell Biol. 19:238–245 - PubMed
    1. Bennetzen M. V., et al. 2010. Site-specific phosphorylation dynamics of the nuclear proteome during the DNA damage response. Mol. Cell Proteomics 9:1314–1323 - PMC - PubMed
    1. Bensimon A., et al. 2010. ATM-dependent and -independent dynamics of the nuclear phosphoproteome after DNA damage. Sci. Signal. 3:rs3. - PubMed
    1. Borst P., Rottenberg S., Jonkers J. 2008. How do real tumors become resistant to cisplatin? Cell Cycle 7:1353–1359 - PubMed
    1. Brozovic A., Osmak M. 2007. Activation of mitogen-activated protein kinases by cisplatin and their role in cisplatin-resistance. Cancer Lett. 251:1–16 - PubMed

Publication types