. 2011 Dec;31(24):4994-5010.
doi: 10.1128/MCB.05694-11. Epub 2011 Oct 17.

Superresolution fluorescence imaging of mitochondrial nucleoids reveals their spatial range, limits, and membrane interaction

Affiliations

Superresolution fluorescence imaging of mitochondrial nucleoids reveals their spatial range, limits, and membrane interaction

Timothy A Brown et al. Mol Cell Biol. 2011 Dec.

Abstract

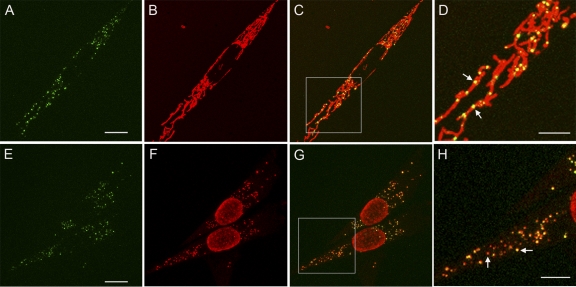
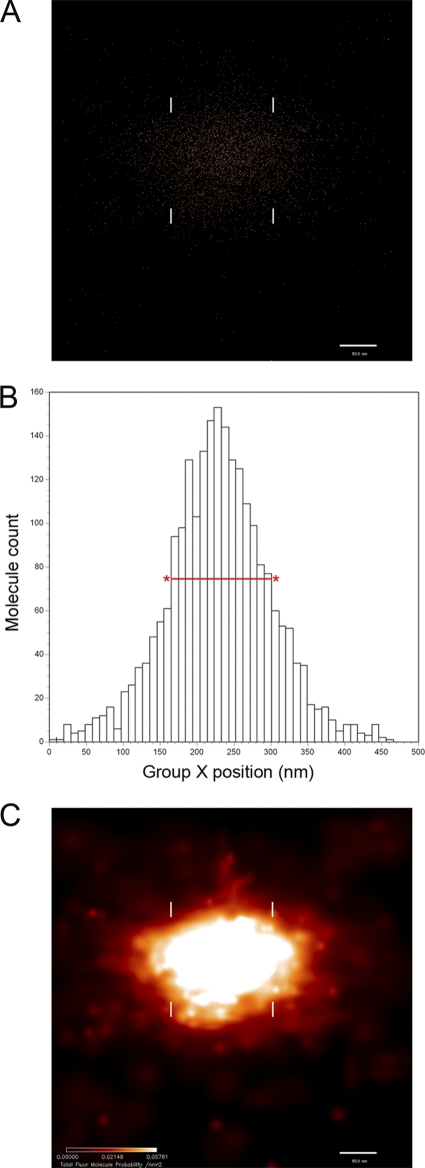
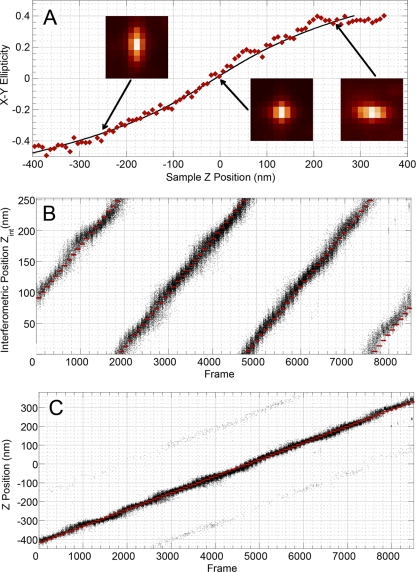
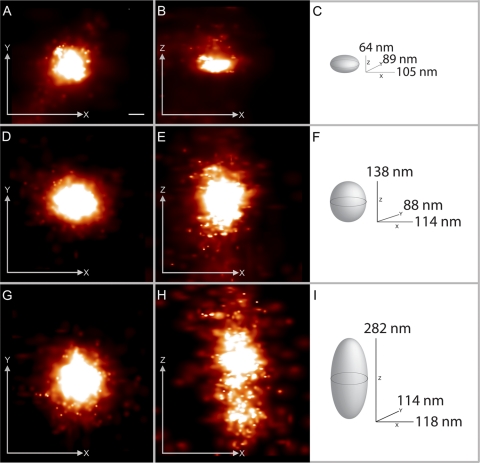
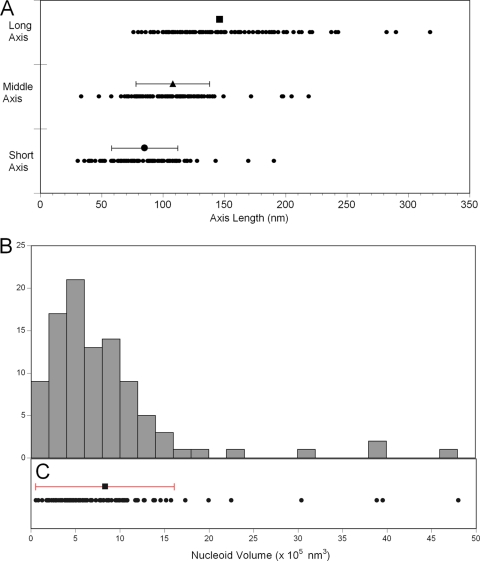
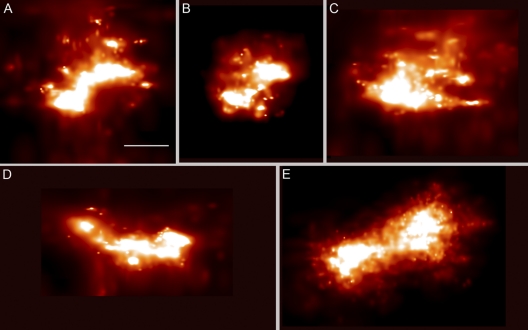
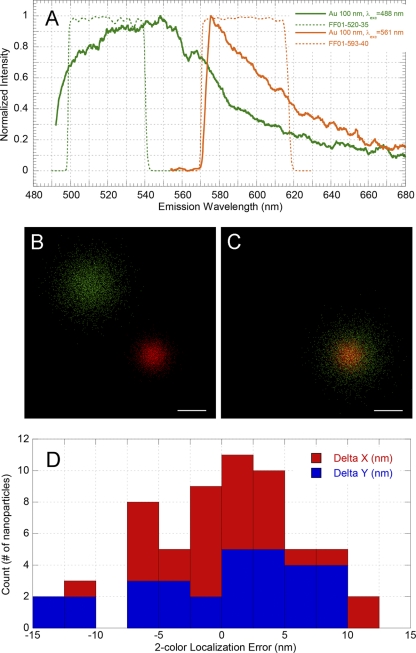
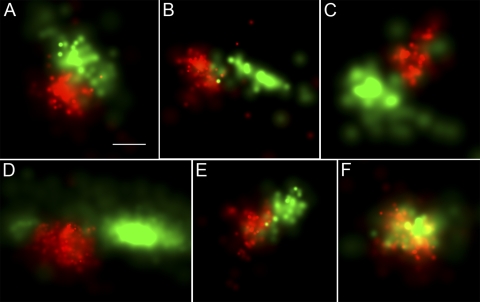
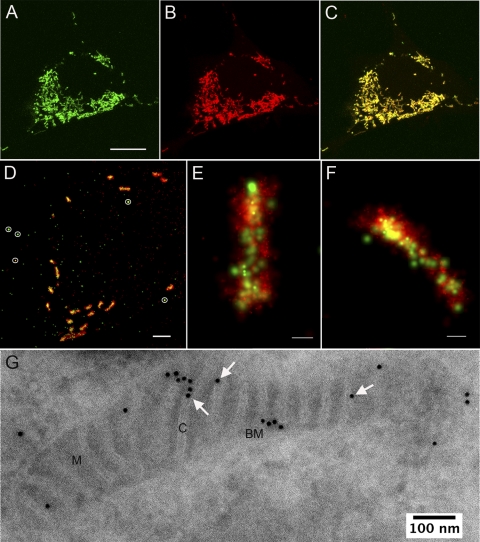
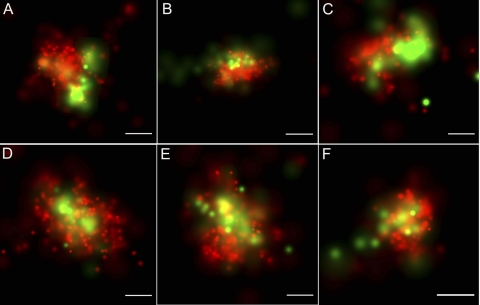
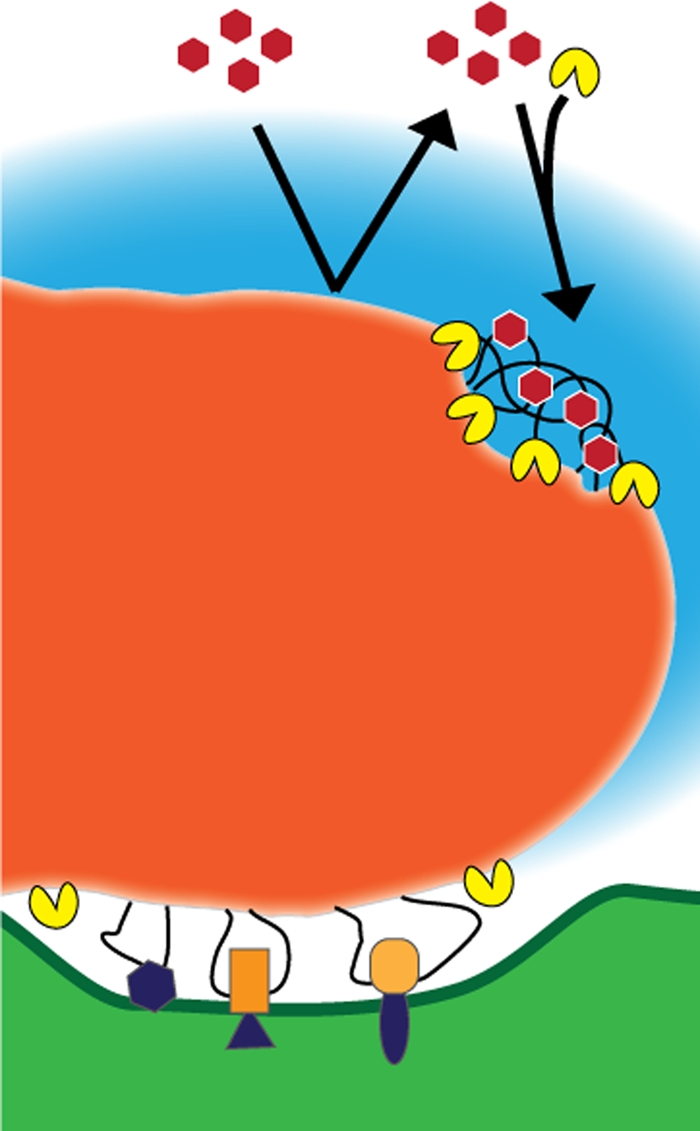
A fundamental objective in molecular biology is to understand how DNA is organized in concert with various proteins, RNA, and biological membranes. Mitochondria maintain and express their own DNA (mtDNA), which is arranged within structures called nucleoids. Their functions, dimensions, composition, and precise locations relative to other mitochondrial structures are poorly defined. Superresolution fluorescence microscopy techniques that exceed the previous limits of imaging within the small and highly compartmentalized mitochondria have been recently developed. We have improved and employed both two- and three-dimensional applications of photoactivated localization microscopy (PALM and iPALM, respectively) to visualize the core dimensions and relative locations of mitochondrial nucleoids at an unprecedented resolution. PALM reveals that nucleoids differ greatly in size and shape. Three-dimensional volumetric analysis indicates that, on average, the mtDNA within ellipsoidal nucleoids is extraordinarily condensed. Two-color PALM shows that the freely diffusible mitochondrial matrix protein is largely excluded from the nucleoid. In contrast, nucleoids are closely associated with the inner membrane and often appear to be wrapped around cristae or crista-like inner membrane invaginations. Determinations revealing high packing density, separation from the matrix, and tight association with the inner membrane underscore the role of mechanisms that regulate access to mtDNA and that remain largely unknown.


Figures

Fig. 1.
Fig. 1.
Genetically expressed TFAM-mEos2 localizes to mtDNA. (A and E) Confocal images of cells displaying the green-state fluorescence of TFAM-mEos2. (B) Mitochondrial staining with Mitotracker Red. (C) Merged images from panels A and B, with box outlining the magnified region displayed in panel D. Arrows in panel D indicate yellow nucleoids within mitochondria. (F) Alexa-Fluor 568 immunofluorescence staining with an anti-DNA antibody. (G) Merged images from panels E and F, with box outlining the magnified region displayed in panel H. Left and right arrows in panel H point to nucleoids with lesser and greater TFAM-mEos2 signals, respectively. Bars, 10 μm (A and E), 5 μm (D and H).
Fig. 2.
Fig. 2.
PALM data representation and measurement of a single nucleoid defined by TFAM-mEos2 fluorescence localization. (A) Fluorescence localization data displayed as a two-dimensional distribution of points, each representing the centroid position of the diffraction-limited image of the fluorescent protein (FP) molecule TFAM-mEos2. (B) Histogram distribution of the FP molecules shown in panel A in the x dimension. The relative position of each bin is displayed on the x axis, with marks every 10 nm. Measurement of the nucleoid x axis width is obtained from the full-width half-maximum of the histogram peak height (FWHM), shown here as a red line with asterisks. (C) The same data displayed as a color-coded probability map of FP molecule locations. The color intensity scale (bottom left) indicates the FP molecule probability per square nanometer. The FWHM positions are also shown in panels A and C with white hash marks. For this molecule, the FWHM value for the x dimension is about 125 nm. (A and C) Bars, 50 nm.
Fig. 3.
Fig. 3.
Point-spread function ellipticity and interferometric z-coordinate display. (A) Three examples of PSF images of gold nanoparticles at different vertical positions are shown. x-y ellipticity is plotted relative to the z position (shown in red). The black line represents the polynomial fit corresponding to equation 2. (B) Interferometric coordinates are displayed as black dots relative to collected frame number. (C) The full z coordinate is displayed relative to frame number as the sample is displaced along the z axis. Sample positions from panels B and C are shown in red.
Fig. 4.
Fig. 4.
Ellipsoidal nucleoid projections and their graphical dimensions obtained from iPALM imaging of TFAM-mEos2. Panels A to C, panels D to F, and panels G to I represent three different nucleoids. In panels A, D, and G, each nucleoid image is projected in x (horizontal) and y (vertical) dimensions. In panels B, E, and H, the z dimension replaces y on the vertical axis. In panels C, F, and I, each nucleoid is graphically displayed along with measurements of full width at half-maximum (FWHM) in three dimensions. Bar, 50 nm (the scale bar in panel A applies to all panels). The fluorescent molecule scale maximum values (representing probability per square nanometer) differ among the panels and range from 0.019 to 0.034.
Fig. 5.
Fig. 5.
Ellipsoidal nucleoid axial dimension and volume distribution. (A) For each nucleoid (n = 98), a short-, middle-, and long-axis length is plotted to display the distribution. Bars representing means (± standard deviations [SD]) are plotted above each data set; the long-axis mean is 146 (±47) nm, the middle-axis mean is 108 (±30) nm, and the short-axis mean is 85 (±27) nm. (B) A 24-bin histogram displaying the frequency distribution of calculated nucleoid volumes. (C) The individual nucleoid volumes (n = 98) are plotted as points along the x axis shared with panel B. The mean (8.5 × 10⁵ nm3) ± SD (7.77 × 10⁵ nm3) is displayed above the raw distribution.
Fig. 6.
Fig. 6.
iPALM imaging reveals that nucleoids are not restricted to ellipsoidal boundaries. TFAM-mEos2-labeled nonelliptical nucleoids exhibit concave, split, and amorphous forms. The fluorescent molecule scale maximum values (representing probability per square nanometer) differ among the panels and range from 0.14 to 0.19. Collectively, these examples represent about 35% of the nucleoid population. Bar, 100 nm (the scale bar in panel A applies to all panels).
Fig. 7.
Fig. 7.
Alignment of dual-label PALM images and colocalization accuracy. Panel A displays emission spectra of 100-nm-diameter gold nanoparticles. Data representing the emission filters used for registration in the 520-nm channel (Semrock FF01-520-35; green dashes) and 590-nm channel (Semrock FF01-593-40; orange dashes) are also shown. (B and C) Two-color PALM image alignment. Localizations of gold nanoparticles at 520 nm (green dots) and 590 nm (red dots) before (B) and after (C) alignment. Bars, 20 nm. Data points were collected from 5,000 frames and peak coordinates extracted for each channel. (D) Two-color localization error distributions. Distances plotted are between averaged coordinates in the 520-nm and 590-nm channels after alignment. Localization differences within the given error range are shown in red for the x axis and in blue for the y axis. The standard deviation for Xx) is 5.1 nm and for Yy) is 6.7 nm.
Fig. 8.
Fig. 8.
TFAM-mEos2 nucleoid location relative to the mitochondrial matrix-targeted CoxVIII1–29-Dronpa. TFAM-mEos2 nucleoids are displayed in red. The mitochondrial matrix protein CoxVIII1-29-Dronpa is shown in green. The fluorescent molecule scale maximum values (probability per square nanometer) differ per panel and range from 0.005 to 0.01 for Dronpa and 0.01 to 0.02 for mEos2. The nucleoid and matrix proteins have discrete boundaries in most (84%) images, as displayed in panels A to E. These edges are less discrete in the remaining 16%, as represented by panel F. Bar, 100 nm (the bar in panel A applies to all panels).
Fig. 9.
Fig. 9.
Genetically expressed LACTB1–68-Dronpa localizes to the mitochondrial intermembrane space. (A to C) Confocal images of a single cell expressing LACTB1–68-Dronpa (A) and mitochondria stained with Mitotracker Red (B); (C) a merged image representing the two labels. (A) Bar, 10 μm. (D to E) Two-color PALM images expressing LACTB1–68-Dronpa (green) and the mitochondrial matrix protein encoded by CoxVIII1-29-mEos2 (red). (D) PALM image showing multiple mitochondria in a cell cross-section; bar, 2 μm. Five gold fiducial particles are circled in white. (E and F) High-resolution two-color PALM images of sectioned mitochondria; bars, 200 nm. The fluorescent molecule scale maximum values (probability per square nanometer) in panels E and F are about 0.0023 for Dronpa and 0.025 for mEos2. (G) Immunogold EM labeling of cryosections of cells with anti-Dronpa antibody, showing LACTB1–68-Dronpa localization to the mitochondrial inner membrane space. M, matrix; C, cristae; BM, boundary membrane. Arrows highlight several gold particles localized to cristae.
Fig. 10.
Fig. 10.
TFAM-mEos2 nucleoid location relative to the IMS targeted LACTB1–68-Dronpa. Two-dimensional, dual-label PALM images of cells expressing inducible TFAM-mEos2 (red) and LACTB1–68-Dronpa (green). The fluorescent molecule scale maximum values (probability per square nanometer) differ per panel and range from 0.002 to 0.01 for Dronpa and from 0.011 to 0.019 for mEos2. TFAM-labeled nucleoids either were located adjacent to the cristae-IMS as shown in panels A to C or surrounded the cristae-IMS as shown in panels D to F). Bars, 100 nm.
Fig. 11.
Fig. 11.
Model illustration of the mammalian mitochondrial nucleoid. The nucleoid core is shown in dark orange. An RNA cloud adjacent to the nucleoid is depicted in blue. Inner membrane connections are displayed here as being mediated by DNA loops that are associated with proteins that are either directly (purple) or indirectly (orange) bound to the membrane. Matrix proteins (red hexagons) are normally excluded from the nucleoid by the highly condensed mtDNA. Matrix and membrane nucleoid-associated proteins gain access to the mtDNA through the regulation of remodeling proteins (yellow).

References

    1. Alam T. I., et al. 2003. Human mitochondrial DNA is packaged with TFAM. Nucleic Acids Res. 31:1640–1645 - PMC - PubMed
    1. Albring M., Griffith J., Attardi G. 1977. Association of a protein structure of probable membrane derivation with HeLa cell mitochondrial DNA near its origin of replication. Proc. Natl. Acad. Sci. U. S. A. 74:1348–1352 - PMC - PubMed
    1. Aquino D., et al. 2011. Two-color nanoscopy of three-dimensional volumes by 4Pi detection of stochastically switched fluorophores. Nat. Methods 8:353–359 - PubMed
    1. Ashley N., Harris D., Poulton J. 2005. Detection of mitochondrial DNA depletion in living human cells using PicoGreen staining. Exp. Cell Res. 303:432–446 - PubMed
    1. Bates M., Huang B., Dempsey G. T., Zhuang X. 2007. Multicolor super-resolution imaging with photo-switchable fluorescent probes. Science 317:1749–1753 - PMC - PubMed

Publication types

LinkOut - more resources