. 2012 Jan;22(1):51-63.
doi: 10.1101/gr.124123.111. Epub 2011 Oct 17.

Death of PRDM9 coincides with stabilization of the recombination landscape in the dog genome

Affiliations

Death of PRDM9 coincides with stabilization of the recombination landscape in the dog genome

Erik Axelsson et al. Genome Res. 2012 Jan.

Erratum in

  • Genome Res. 2012 Apr;22(4):810

Abstract

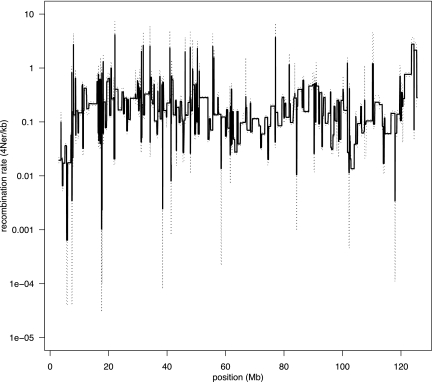
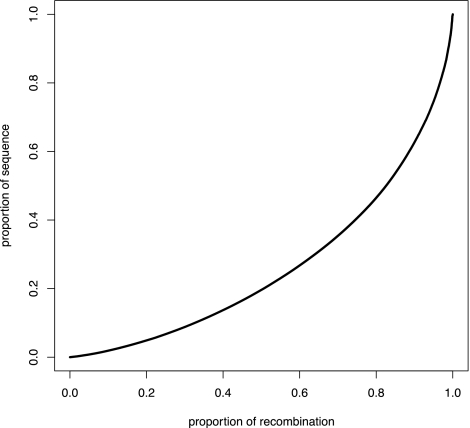
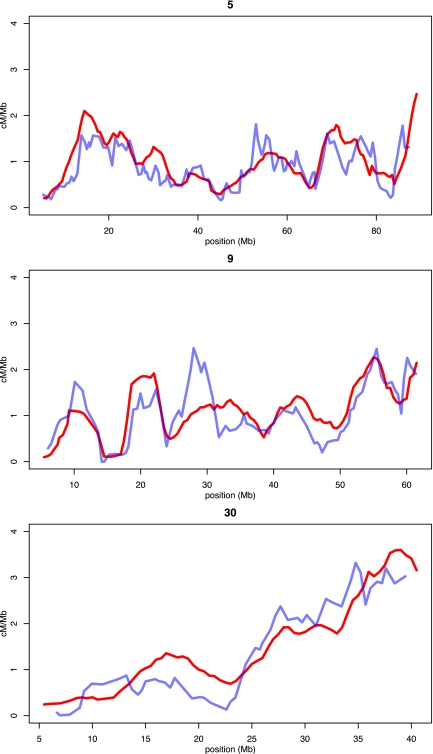
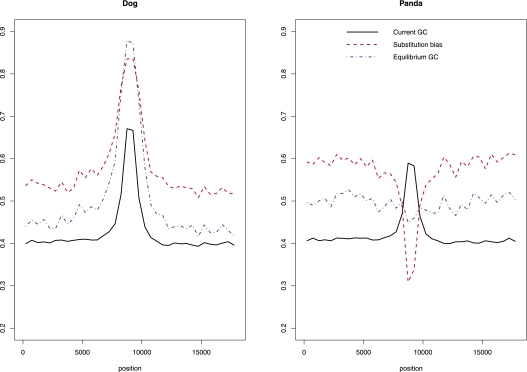
Analysis of diverse eukaryotes has revealed that recombination events cluster in discrete genomic locations known as hotspots. In humans, a zinc-finger protein, PRDM9, is believed to initiate recombination in >40% of hotspots by binding to a specific DNA sequence motif. However, the PRDM9 coding sequence is disrupted in the dog genome assembly, raising questions regarding the nature and control of recombination in dogs. By analyzing the sequences of PRDM9 orthologs in a number of dog breeds and several carnivores, we show here that this gene was inactivated early in canid evolution. We next use patterns of linkage disequilibrium using more than 170,000 SNP markers typed in almost 500 dogs to estimate the recombination rates in the dog genome using a coalescent-based approach. Broad-scale recombination rates show good correspondence with an existing linkage-based map. Significant variation in recombination rate is observed on the fine scale, and we are able to detect over 4000 recombination hotspots with high confidence. In contrast to human hotspots, 40% of canine hotspots are characterized by a distinct peak in GC content. A comparative genomic analysis indicates that these peaks are present also as weaker peaks in the panda, suggesting that the hotspots have been continually reinforced by accelerated and strongly GC biased nucleotide substitutions, consistent with the long-term action of biased gene conversion on the dog lineage. These results are consistent with the loss of PRDM9 in canids, resulting in a greater evolutionary stability of recombination hotspots. The genetic determinants of recombination hotspots in the dog genome may thus reflect a fundamental process of relevance to diverse animal species.


Figures

Figure 1.
Figure 1.
Recombination rate (4Ner/kb) variation across dog chromosome 1, as inferred using interval. (Solid line) Mean posterior estimated rate; (dashed lines) 2.5 and 97.5 percentiles of the posterior.
Figure 2.
Figure 2.
Proportion of sequence versus the proportion of recombination. The cumulative proportion of the total length of the dog recombination map is plotted against the proportion of the genome that has been sampled. This analysis suggests that 80% of all recombination events occur in 46% of the dog genome. Due to the relatively sparse marker density in our data set, we believe that this figure represents an underestimate of the true recombination rate variation in dog.
Figure 3.
Figure 3.
Decay of linkage disequilibrium (LD-decay) in 30 dog breeds and the wolf. Average LD-decay, measured as r2 for markers separated by, at most, 400 kb, is plotted for 10-kb bins.
Figure 4.
Figure 4.
Power simulations to test the ability of interval to infer recombination rate variation in the dog. By using a realistic demographic model, we generated genotype data for 1-Mb regions centered around a hotspot of recombination with known intensity and width. Recombination rates outside the hotspot were kept uniform. Nine different scenarios were simulated in which hotspot intensity that varied from weak (20× background rate), to intermediate (100× background rate), to strong (1000× background rate) were combined with three different hotspot widths (2, 10, and 100 kb). We set interval to penalize rate change (bp = 20) and inferred recombination rates in 100 simulated data sets for each scenario, and compared the average inferred rate (solid black line) to the uniform background rate (gray solid line), as well as the hotspot intensity (solid blue bars) used in the simulations. Dotted lines show the 2.5 and 97.5 percentiles of the sampling distribution.
Figure 5.
Figure 5.
Comparing recombination rates in the LD-based recombination map and a previously published linkage map for chromosomes 5, 9, and 30. Recombination rates of the linkage map (blue lines) and our LD-based inference (red lines) have been averaged across 5-Mb windows prior to plotting. We rescaled population genetic estimates by estimating the effective population size (Ne) of the dog from comparing the complete extension of the overlapping portions of the two complete recombination maps.
Figure 6.
Figure 6.
The molecular evolution of GC peaks in the dog and panda. Three hundred nine GC peaks for which we had alignment data for the dog, panda, and cat were centered in 18-kb windows prior to analyses. We used a sliding window of 500 bp to estimate average values of three different parameters related to the evolution of base composition near GC peaks in the dog and panda. First, solid black lines depict the average current GC content. Second, red lines show the nucleotide substitution bias (SB = WS/[WS + SW], where numbers of strong-to-weak [GC-to-AT] and weak-to-strong [AT-to-GC] substitutions are SW and WS, respectively). Third, blue lines show the equilibrium GC content (GC* = u/[u + v], where the rate of strong-to-weak [GC-to-AT] and weak-to-strong [AT-to-GC] substitutions are u and v, respectively).

References

    1. Arnheim N, Calabrese P, Tiemann-Boege I 2007. Mammalian meiotic recombination hot spots. Annu Rev Genet 41: 369–399 - PubMed
    1. Auton A, McVean G 2007. Recombination rate estimation in the presence of hotspots. Genome Res 17: 1219–1227 - PMC - PubMed
    1. Baudat F, Buard J, Grey C, Fledel-Alon A, Ober C, Przeworski M, Coop G, de Massy B 2010. PRDM9 is a major determinant of meiotic recombination hotspots in humans and mice. Science 327: 836–840 - PMC - PubMed
    1. Berg IL, Neumann R, Lam KWG, Sarbajna S, Odenthal-Hesse L, May CA, Jeffreys AJ 2010. PRDM9 variation strongly influences recombination hot-spot activity and meiotic instability in humans. Nat Genet 42: 859–863 - PMC - PubMed
    1. Berglund J, Pollard KS, Webster MT 2009. Hotspots of biased nucleotide substitutions in human genes. PLoS Biol 7: e26 doi: 10.1371/journal.pbio.1000026 - PMC - PubMed

Publication types

Substances