. 2011 Nov 1;108(44):17876-82.
doi: 10.1073/pnas.1114477108. Epub 2011 Oct 17.

Physical limits of cells and proteomes

Affiliations

Physical limits of cells and proteomes

Ken A Dill et al. Proc Natl Acad Sci U S A. .

Abstract

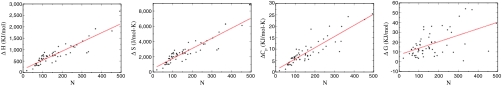
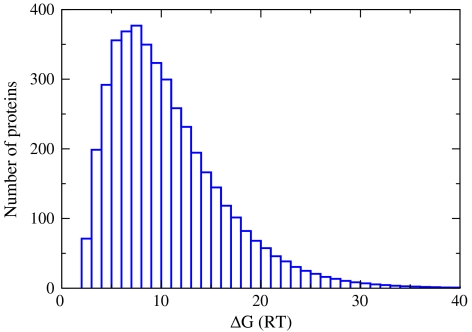
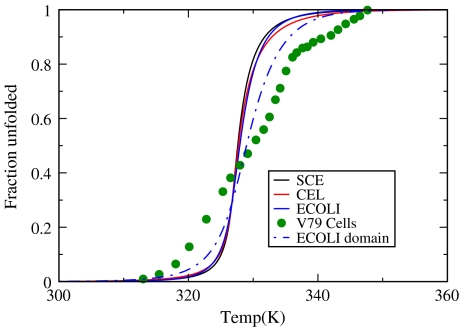
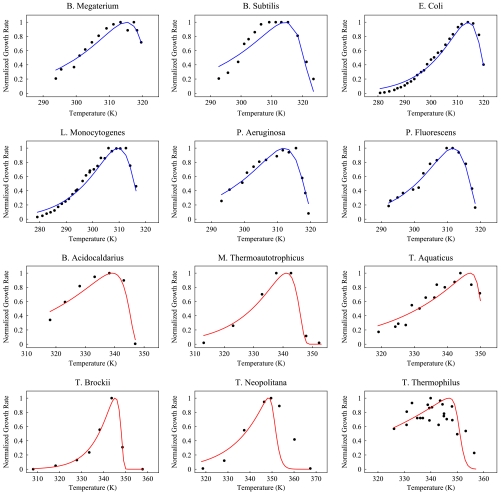
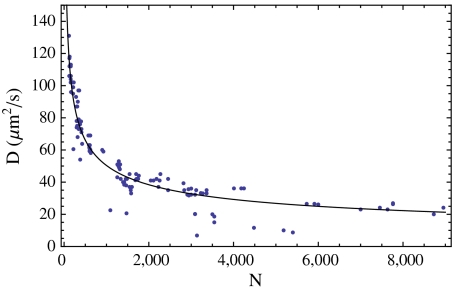
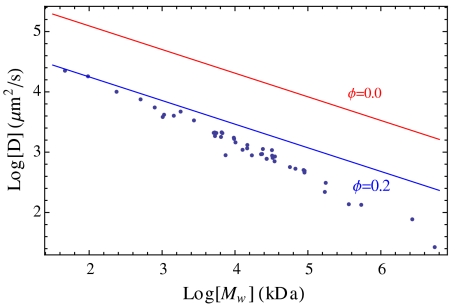
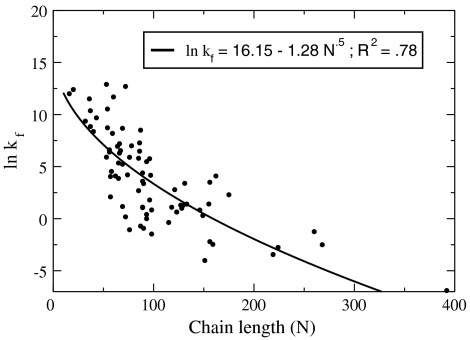
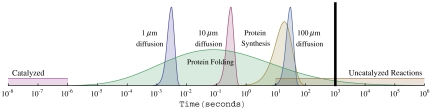
What are the physical limits to cell behavior? Often, the physical limitations can be dominated by the proteome, the cell's complement of proteins. We combine known protein sizes, stabilities, and rates of folding and diffusion, with the known protein-length distributions P(N) of proteomes (Escherichia coli, yeast, and worm), to formulate distributions and scaling relationships in order to address questions of cell physics. Why do mesophilic cells die around 50 °C? How can the maximal growth-rate temperature (around 37 °C) occur so close to the cell-death temperature? The model shows that the cell's death temperature coincides with a denaturation catastrophe of its proteome. The reason cells can function so well just a few degrees below their death temperature is because proteome denaturation is so cooperative. Why are cells so dense-packed with protein molecules (about 20% by volume)? Cells are packed at a density that maximizes biochemical reaction rates. At lower densities, proteins collide too rarely. At higher densities, proteins diffuse too slowly through the crowded cell. What limits cell sizes and growth rates? Cell growth is limited by rates of protein synthesis, by the folding rates of its slowest proteins, and--for large cells--by the rates of its protein diffusion. Useful insights into cell physics may be obtainable from scaling laws that encapsulate information from protein knowledge bases.


Conflict of interest statement

The authors declare no conflict of interest.

Figures

Fig. 1.
Fig. 1.
Thermal protein properties depend linearly on chain length. (A) ΔH, enthalpy of unfolding at 100.5 °C, (B) ΔS, entropy of unfolding at 112 °C, and (C) ΔCp, temperature independent heat capacity of unfolding. (D) Free energy of folding at 37 °C determined for 59 different proteins are plotted as a function of chain length, N. The red lines in A, B, and C are the linear regressions. The red line in D is the predicted ΔG; it combines the best-fit values of changes in enthalpy, entropy, and specific heat on chain lengths obtained in A, B, and C. Reprinted from ref. , Copyright 2011, with permission from Elsevier.
Fig. 2.
Fig. 2.
Distribution of free energies of folding of the proteins in the proteomes of E. coli at 37 °C. The free-energy bin size is 1RT. Area under the curve equals the total number of proteins in the proteome (4,300 for E. coli).
Fig. 3.
Fig. 3.
The fraction of proteins that are unfolded in the proteomes of E. coli, yeast (SCE), and worm (CEL) as a function of temperature. Solid circles show experimentally measured fraction denatured proteins as a function of temperature for mammalian V79 cells using differential scanning calorimetry (9). The blue dashed line shows the results based on domain length distribution (69) in E. coli genome.
Fig. 4.
Fig. 4.
Black circles denote growth rate as a function of temperature for species listed. On the Y axis, we plot growth rate normalized with respect to maximum growth rate, whereas on the X axis we plot temperature. Solid lines are fit to data from Eq. 8. Red graphs denote thermophilic species, whereas blue curves are for mesophiles. Sources of the data are given in table 2 in the supplemental material of ref. . Reprinted from ref. , Copyright 2011, with permission from Elsevier.
Fig. 5.
Fig. 5.
Dependence of diffusion constant on chain length. Comparison of experimental in vitro diffusion constants (52) to Eq. 9 with the Tyn and Gusek approximation Rh = 1.45Rn. Molecular weights have been converted to amino acid numbers using N = Mw/110 Da.
Fig. 6.
Fig. 6.
Effect of crowding on diffusion constants. Computed diffusion constants at infinite dilution (ϕ = 0) and in the presence of crowding compared to the steric interaction simulation of McGuffee and Elcock (15).
Fig. 7.
Fig. 7.
Chain-length dependent fit (Eq. 16 using result from ref. 61) to the folding rates of 80 proteins including two-state and multistate folders (62). Data in circles and fit in solid line.
Fig. 8.
Fig. 8.
Smoothed histograms (logarithmically spaced bins) of the time distributions for protein folding, translation, and diffusion compared to the range of reaction rates reported by ref. . Folding time distribution was calculated using domain length distribution in the proteome of E. coli and Eq. 16. The vertical line indicates 20 min, roughly the replication speed limit for E. coli.

Comment in

  • Profile of Ken A. Dill.
    Gupta S. Gupta S. Proc Natl Acad Sci U S A. 2012 Feb 28;109(9):3194-6. doi: 10.1073/pnas.1200576109. Epub 2012 Feb 6. Proc Natl Acad Sci U S A. 2012. PMID: 22315429 Free PMC article. No abstract available.
  • Optimal macromolecular density in the cell.
    Vazquez A. Vazquez A. Proc Natl Acad Sci U S A. 2012 Feb 28;109(9):E533; author reply E534. doi: 10.1073/pnas.1118500109. Epub 2012 Feb 17. Proc Natl Acad Sci U S A. 2012. PMID: 22343528 Free PMC article. No abstract available.

References

    1. Alberts B, et al. Molecular Biology of the Cell. New York: Garland Science; 2002.
    1. Phillips R, Kondev J, Theriot J. Physical Biology of the Cell. New York: Garland Science; 2008.
    1. Nelson P. Biological Physics Energy, Information, Life. New York: Freeman and Company; 2008.
    1. Thirumalai D, OBrien EP, Morrison G, Hyeon C. Theoretical perspectives on protein folding. Annu Rev Biophys. 2010;39:159–183. - PubMed
    1. Robertson AD, Murphy KP. Protein structure and the energetics of protein stability. Chem Rev. 1997;97:1251–1267. - PubMed

Publication types