Antitumorigenic potential of STAT3 alternative splicing modulation
- PMID: 22006329
- PMCID: PMC3203802
- DOI: 10.1073/pnas.1108482108
Antitumorigenic potential of STAT3 alternative splicing modulation
Abstract
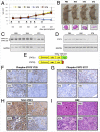
Signal transducer and activator of transcription 3 (STAT3) plays a central role in the activation of multiple oncogenic pathways. Splicing variant STAT3β uses an alternative acceptor site within exon 23 that leads to a truncated isoform lacking the C-terminal transactivation domain. Depending on the context, STAT3β can act as a dominant-negative regulator of transcription and promote apoptosis. We show that modified antisense oligonucleotides targeted to a splicing enhancer that regulates STAT3 exon 23 alternative splicing specifically promote a shift of expression from STAT3α to STAT3β. Induction of endogenous STAT3β leads to apoptosis and cell-cycle arrest in cell lines with persistent STAT3 tyrosine phosphorylation compared with total STAT3 knockdown obtained by forced splicing-dependent nonsense-mediated decay (FSD-NMD). Comparison of the molecular effects of splicing redirection to STAT3 knockdown reveals a unique STAT3β signature, with a down-regulation of specific targets (including lens epithelium-derived growth factor, p300/CBP-associated factor, CyclinC, peroxisomal biogenesis factor 1, and STAT1β) distinct from canonical STAT3 targets typically associated with total STAT3 knockdown. Furthermore, similar in vivo redirection of STAT3 alternative splicing leads to tumor regression in a xenograft cancer model, demonstrating how pharmacological manipulation of a single key splicing event can manifest powerful antitumorigenic properties and validating endogenous splicing reprogramming as an effective cancer therapeutic approach.
Conflict of interest statement
The authors declare no conflict of interest.
Figures


Similar articles
-
Oligonucleotide-directed STAT3 alternative splicing switch drives anti-tumorigenic outcomes in MCF10 human breast cancer cells.Biochem Biophys Res Commun. 2019 Jun 11;513(4):1076-1082. doi: 10.1016/j.bbrc.2019.04.054. Epub 2019 Apr 19. Biochem Biophys Res Commun. 2019. PMID: 31010684
-
Identification of Entinostat as a Novel Modifier of STAT3 Pre-mRNA Alternative Splicing.Biol Pharm Bull. 2024;47(9):1504-1510. doi: 10.1248/bpb.b24-00404. Biol Pharm Bull. 2024. PMID: 39284734
-
RNA binding protein CUGBP2/ETR-3 regulates STAT3 alternative splicing.Biochem Biophys Res Commun. 2024 Dec 20;739:151000. doi: 10.1016/j.bbrc.2024.151000. Epub 2024 Nov 14. Biochem Biophys Res Commun. 2024. PMID: 39550869
-
STAT3beta, a distinct isoform from STAT3.Int J Biochem Cell Biol. 2019 May;110:130-139. doi: 10.1016/j.biocel.2019.02.006. Epub 2019 Feb 26. Int J Biochem Cell Biol. 2019. PMID: 30822557 Review.
-
Of alphas and betas: distinct and overlapping functions of STAT3 isoforms.Front Biosci. 2008 May 1;13:6501-14. doi: 10.2741/3170. Front Biosci. 2008. PMID: 18508676 Review.
Cited by
-
Modulation of Bcl-x Alternative Splicing Induces Apoptosis of Human Hepatic Stellate Cells.Biomed Res Int. 2016;2016:7478650. doi: 10.1155/2016/7478650. Epub 2016 Aug 7. Biomed Res Int. 2016. PMID: 27579319 Free PMC article.
-
STAT3, the Challenge for Chemotherapeutic and Radiotherapeutic Efficacy.Cancers (Basel). 2020 Aug 30;12(9):2459. doi: 10.3390/cancers12092459. Cancers (Basel). 2020. PMID: 32872659 Free PMC article. Review.
-
Stress-induced lncRNA LASTR fosters cancer cell fitness by regulating the activity of the U4/U6 recycling factor SART3.Nucleic Acids Res. 2020 Mar 18;48(5):2502-2517. doi: 10.1093/nar/gkz1237. Nucleic Acids Res. 2020. PMID: 31956895 Free PMC article.
-
Overexpression of STAT3/pSTAT3 was associated with poor prognosis in gastric cancer: a meta-analysis.Int J Clin Exp Med. 2015 Nov 15;8(11):20014-23. eCollection 2015. Int J Clin Exp Med. 2015. PMID: 26884913 Free PMC article.
-
Regulation of RNA Splicing: Aberrant Splicing Regulation and Therapeutic Targets in Cancer.Cells. 2021 Apr 16;10(4):923. doi: 10.3390/cells10040923. Cells. 2021. PMID: 33923658 Free PMC article. Review.
References
-
- Darnell JE., Jr Transcription factors as targets for cancer therapy. Nat Rev Cancer. 2002;2:740–749. - PubMed
-
- Haura EB, Turkson J, Jove R. Mechanisms of disease: Insights into the emerging role of signal transducers and activators of transcription in cancer. Nat Clin Pract Oncol. 2005;2:315–324. - PubMed
-
- Inghirami G, et al. New and old functions of STAT3: A pivotal target for individualized treatment of cancer. Cell Cycle. 2005;4:1131–1133. - PubMed
Publication types
MeSH terms
Substances
Grants and funding
LinkOut - more resources
Full Text Sources
Other Literature Sources
Molecular Biology Databases
Miscellaneous

