Clinical Trial
. 2012 Feb;55(2):512-21.
doi: 10.1002/hep.24748.

Biochemical and immunologic effects of rituximab in patients with primary biliary cirrhosis and an incomplete response to ursodeoxycholic acid

Affiliations
Clinical Trial

Biochemical and immunologic effects of rituximab in patients with primary biliary cirrhosis and an incomplete response to ursodeoxycholic acid

Masanobu Tsuda et al. Hepatology. 2012 Feb.

Abstract

The aim of this study was to determine the safety and potential efficacy of B-cell depletion with the anti-CD20 monoclonal antibody rituximab in patients with primary biliary cirrhosis (PBC) and an incomplete response to ursodeoxycholic acid (UDCA). This open-label study enrolled six patients with PBC and incomplete responses to UDCA to be treated with 2 doses of 1000 mg rituximab separated by 2 weeks and followed for 52 weeks. The primary endpoints were safety and changes in B-cell function. Two patients received only 1 dose of rituximab, one due to activation of latent varicella and the other due to a viral upper respiratory infection. Serum levels of total IgG, IgM, and IgA as well as anti-mitochondrial autoantibodies (AMAs) IgA and IgM decreased significantly from baseline by 16 weeks and returned to baseline levels by 36 weeks. Stimulation of B cells with CpG produced significantly less IgM at 52 weeks after treatment compared with B cells at baseline. In addition, transient decreases in memory B-cell and T-cell frequencies and an increase in CD25(high) CD4(+) T cells were observed after treatment. These changes were associated with significant increases in mRNA levels of FoxP3 and transforming growth factor-β (TGF-β) and a decrease in tumor necrosis factor-α (TNF-α) in CD4(+) T cells. Notably, serum alkaline phosphatase levels were significantly reduced up to 36 weeks following rituximab treatment.

Conclusion: These data suggest that depletion of B cells influences the induction, maintenance, and activation of both B and T cells and provides a potential mechanism for treatment of patients with PBC with an incomplete response to UDCA.


Figures

Figure 1.
Figure 1.. Effects of B-cell depletion on plasma immunoglobulin.
A-C. Plasma Concentrations of immunoglobulins were measured at 0 weeks (baseline), 2 weeks, 16 weeks, 24 weeks, 36 weeks, and 52 weeks after the initial treatment with rituximab. The upper bar graphs represent mean concentrations (mg/ml) ± SEM and the lower line charts represent individual concentrations. * p<0.05 in two-tailed Wilcoxon matched pairs test.
Figure 2.
Figure 2.. Antibody against to PDC-E2 (AMA)
Plasma levels of AMA were measured at 0 weeks (baseline), 2 weeks, 16 weeks, 24 weeks, 36 weeks, and 52 weeks after the first treatment with rituximab. The upper line charts represent mean levels (O.D.) ± SEM and the lower line charts represent individual concentrations. A. Quantification of total anti-PDC-E2 (AMA) in the plasma. B-D. Each immunoglobulin subtype of AMA in the plasma.
Figure 3.
Figure 3.. Secretion of immunoglobulin and AMA in cultured cultured B cell
CD19+ B cell (2.0 x 10⁵) and CD19 non B cell (8.0 x 10⁵) were co-cultured with 2μM CpG-B for 96 hrs. Supernatant was collected and immunoglobulin and AMA were measured. Data is presented as mean ± SEM A-C. Mean level of IgA (0w: 45.7 ± 21.8 ng/ml; 52w: 61.1 ± 52.8 ng/ml), IgM (0w: 241.7 ± 101.4 ng/ml; 52w: 30.1 ± 9.0 ng/ml), and IgG (0w: 165.9 ± 49.1 vs. 52 weeks: 83.6 ± 31.6). D. Upper bar graph, mean titers of AMA (0w: 1.11 ± 0.42 O.D.; 52w: 0.44 ± 0.31 O.D.). Lower line chart, individual titer of AMA. * p<0.05 in two-tailed Wilcoxon matched pairs test
Figure 4.
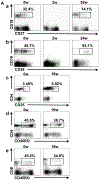
Figure 4.. Changes in the percentage of T, B, and NK cells in peripheral blood mononuclear cells (PBMC).
CD20+, CD4+, and CD8+ cells were analyzed by FACS at 0 weeks (baseline), 2 weeks, 16 weeks, 24 weeks, 36 weeks, and 52 weeks after the first treatment with rituximab. The percentages of CD27+ cells in the CD20+ compartment (memory B+ cells), CD38+ cells in the CD20+ compartment (repopulating immature B cells), CD25high cells in the CD4+ compartment (regulatory CD4+ T cells), CD45RO+ cells in the CD4+ compartment (memory CD4+ T cells), and CD45RO+ cells in the CD8+ compartment (memory CD8+ T cells) was determined. A. Dot plots of flow cytometry. Panel a. CD20+ cells were isolated and analyzed for CD27+ cells. Panel a shows the FACS data collected at weeks 0, 2, and 52. Panel b. CD20+ cells were isolated and analyzed for CD38+ cells. Panel b shows the FACS data collected at weeks 0, 2, and 24. Panel c. CD4+ cells were isolated and analyzed for CD25+ cells. Panel c shows the FACS data collected at weeks 0 and 16. Panel d. CD4+ cells were isolated and analyzed for CD45RO+ cells. Panel d shows the FACS data collected at weeks 0 and 16. Panel e. CD8+ cells were isolated and analyzed for CD45RO+ cells. Panel e shows the FACS data collected at weeks 0 and 16. B. Graphical representation of the FACS data. Panels a-e. The upper line charts represents mean percentages ± SEM and the lower line charts represents individual data. * p<0.05 in two-tailed Wilcoxon matched pairs test
Figure 5.
Figure 5.. Relative expression of FoxP3 and cytokine mRNA in CD4+ T cells and cytotoxic enzyme on CD8+ T cells.
The mRNA levels at the indicated time points were calculated relative to the baseline levels (values obtained prior to rituximab treatment) after normalization to a the house keeping gene GAPDH. A-H. Graphical representation of relative mRNA expression levels. * p<0.05 in two-tailed Wilcoxon matched pairs test.
Figure 6.
Figure 6.. Level of serum alkaline phosphatase, AST, ALT, g-GTP and T. Bil.
A-E. Serum liver enzyme activities (IU/L) and total bilirubin concentrations (mg/dl) were measured at 0 weeks (baseline), 2 weeks, 16 weeks, 24 weeks, 36 weeks, and 52 weeks after the first treatment with rituximab. The upper bar graphs represent mean levels ± SEM and the lower line charts represent individual levels. * p<0.05 in two-tailed Wilcoxon matched pairs test.

References

    1. Gershwin ME and Mackay IR. The causes of primary biliary cirrhosis: Convenient and inconvenient truths. Hepatology 2008;47:737–45. - PubMed
    1. Kaplan MM and Gershwin ME. Primary biliary cirrhosis. N Engl J Med 2005;353:1261–73. - PubMed
    1. Gershwin ME, Mackay IR, Sturgess A and Coppel RL. Identification and specificity of a cDNA encoding the 70 kd mitochondrial antigen recognized in primary biliary cirrhosis. J Immunol 1987;138:3525–31. - PubMed
    1. Kamihira T, Shimoda S, Harada K, Kawano A, Handa M, Baba E, et al. Distinct costimulation dependent and independent autoreactive T-cell clones in primary biliary cirrhosis. Gastroenterology 2003;125:1379–87. - PubMed
    1. Kita H, Matsumura S, He XS, Ansari AA, Lian ZX, Van de Water J, et al. Quantitative and functional analysis of PDC-E2-specific autoreactive cytotoxic T lymphocytes in primary biliary cirrhosis. J Clin Invest 2002;109:1231–40. - PMC - PubMed

Publication types

MeSH terms