

Transient decrease in tumor oxygenation after intravenous administration of pyruvate
- PMID: 22006570
- PMCID: PMC3262125
- DOI: 10.1002/mrm.23065
Transient decrease in tumor oxygenation after intravenous administration of pyruvate
Abstract
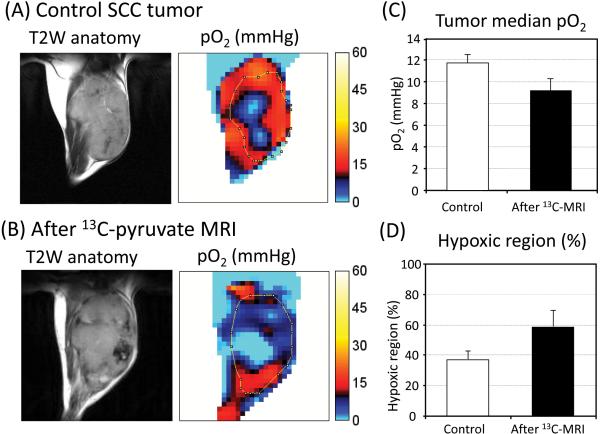
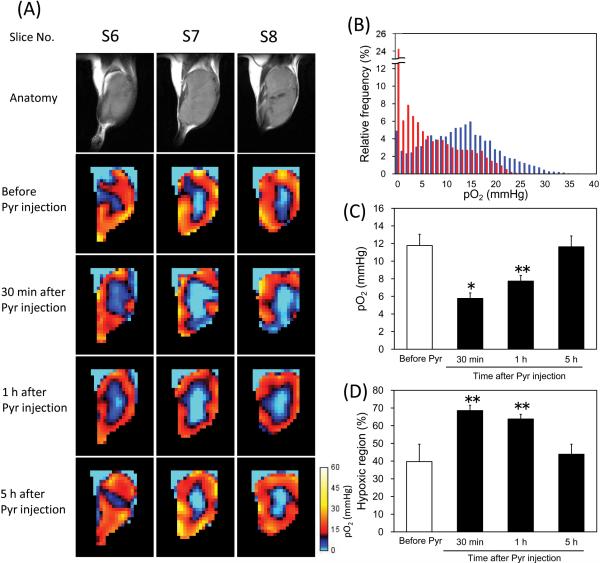
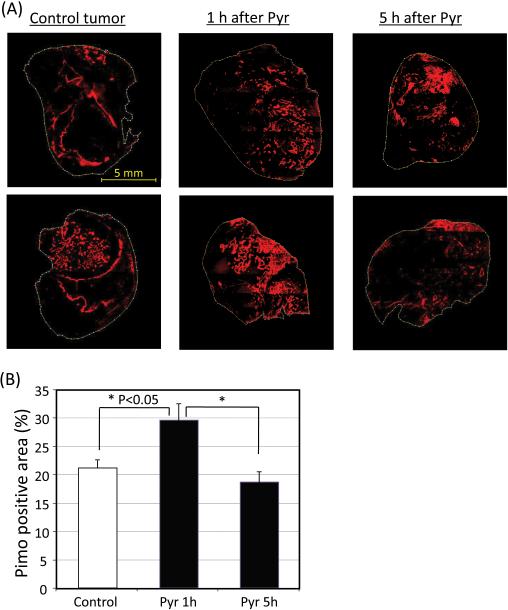
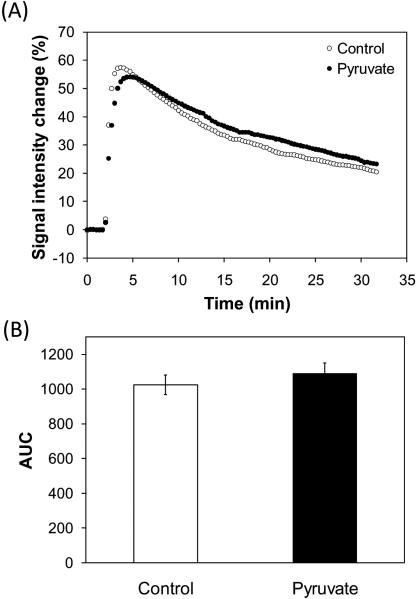
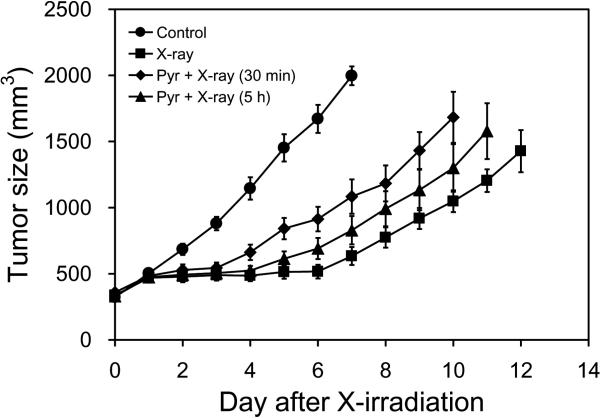
MRI using hyperpolarized (13) C-labeled pyruvate is a promising tool to biochemically profile tumors and monitor their response to therapy. This technique requires injection of pyruvate into tumor-bearing animals. Pyruvate is an endogenous entity but the influence of exogenously injected bolus doses of pyruvate on tumor microenvironment is not well understood. In this study, the effect of injecting a bolus of pyruvate on tumor oxygen status was investigated. EPR oxygen imaging revealed that the partial pressure of oxygen (pO(2)) in squamous cell carcinoma implanted in mice decreased significantly 30 min after [1-(13) C]pyruvate injection, but recovered to preinjection levels after 5 h. Dynamic contrast-enhanced-MRI studies showed that, at the dose of pyruvate used, no changes in tumor perfusion were noticed. Immunohistochemical analysis of hypoxic marker pimonidazole independently verified that the squamous cell carcinoma tumor transiently became more hypoxic by pyruvate injection. Efficacy of radiotherapy was suppressed when X-irradiation was delivered during the period of pyruvate-induced transient hypoxia. These results suggest importance of taking into account the transient decrease in tumor pO(2) after pyruvate injection in hyperpolarized (13) C MRI, because tumor oxygen status is an important factor in determining outcomes of therapies.
Copyright © 2011 Wiley Periodicals, Inc.
Figures
Similar articles
-
EPR oxygen imaging and hyperpolarized 13C MRI of pyruvate metabolism as noninvasive biomarkers of tumor treatment response to a glycolysis inhibitor 3-bromopyruvate.Magn Reson Med. 2013 May;69(5):1443-50. doi: 10.1002/mrm.24355. Epub 2012 Jun 12. Magn Reson Med. 2013. PMID: 22692861 Free PMC article.
-
13C-MR Spectroscopic Imaging with Hyperpolarized [1-13C]pyruvate Detects Early Response to Radiotherapy in SCC Tumors and HT-29 Tumors.Clin Cancer Res. 2015 Nov 15;21(22):5073-81. doi: 10.1158/1078-0432.CCR-14-1717. Epub 2015 Feb 11. Clin Cancer Res. 2015. PMID: 25673698 Free PMC article.
-
Pyruvate induces transient tumor hypoxia by enhancing mitochondrial oxygen consumption and potentiates the anti-tumor effect of a hypoxia-activated prodrug TH-302.PLoS One. 2014 Sep 25;9(9):e107995. doi: 10.1371/journal.pone.0107995. eCollection 2014. PLoS One. 2014. PMID: 25254649 Free PMC article.
-
Low-field magnetic resonance imaging to visualize chronic and cycling hypoxia in tumor-bearing mice.Cancer Res. 2010 Aug 15;70(16):6427-36. doi: 10.1158/0008-5472.CAN-10-1350. Epub 2010 Jul 20. Cancer Res. 2010. PMID: 20647318 Free PMC article.
-
Direct and indirect assessment of cancer metabolism explored by MRI.NMR Biomed. 2019 Oct;32(10):e3966. doi: 10.1002/nbm.3966. Epub 2018 Aug 31. NMR Biomed. 2019. PMID: 30169896 Review.
Cited by
-
Targeting the metabolic microenvironment of tumors.Adv Pharmacol. 2012;65:63-107. doi: 10.1016/B978-0-12-397927-8.00004-X. Adv Pharmacol. 2012. PMID: 22959024 Free PMC article. Review.
-
Evaluation of hyperpolarized [1-¹³C]-pyruvate by magnetic resonance to detect ionizing radiation effects in real time.PLoS One. 2014 Jan 27;9(1):e87031. doi: 10.1371/journal.pone.0087031. eCollection 2014. PLoS One. 2014. PMID: 24475215 Free PMC article.
-
Lactate saturation limits bicarbonate detection in hyperpolarized 13 C-pyruvate MRI of the brain.Magn Reson Med. 2022 Sep;88(3):1170-1179. doi: 10.1002/mrm.29290. Epub 2022 May 9. Magn Reson Med. 2022. PMID: 35533254 Free PMC article.
-
Co-imaging of the tumor oxygenation and metabolism using electron paramagnetic resonance imaging and 13-C hyperpolarized magnetic resonance imaging before and after irradiation.Oncotarget. 2018 May 18;9(38):25089-25100. doi: 10.18632/oncotarget.25317. eCollection 2018 May 18. Oncotarget. 2018. PMID: 29861855 Free PMC article.
-
In vivo preclinical cancer and tissue engineering applications of absolute oxygen imaging using pulse EPR.J Magn Reson. 2017 Jul;280:149-157. doi: 10.1016/j.jmr.2017.04.017. Epub 2017 Apr 30. J Magn Reson. 2017. PMID: 28552587 Free PMC article. Review.
References
-
- Kohler SJ, Yen Y, Wolber J, Chen AP, Albers MJ, Bok R, Zhang V, Tropp J, Nelson S, Vigneron DB, Kurhanewicz J, Hurd RE. In vivo 13carbon metabolic imaging at 3T with hyperpolarized 13C-1-pyruvate. Magn Reson Med. 2007;58:65–69. - PubMed
-
- Golman K, Zandt R, Lerche M, Pehrson R, Ardenkjaer-Larsen JH. Metabolic imaging by hyperpolarized 13C magnetic resonance imaging for in vivo tumor diagnosis. Cancer Res. 2006;66:10855–10860. - PubMed
-
- Albers MJ, Bok R, Chen AP, Cunningham CH, Zierhut ML, Zhang VY, Kohler SJ, Tropp J, Hurd RE, Yen YF, Nelson SJ, Vigneron DB, Kurhanewicz J. Hyperpolarized 13C lactate, pyruvate, and alanine: noninvasive biomarkers for prostate cancer detection and grading. Cancer Res. 2008;68:8607–8615. - PMC - PubMed
MeSH terms
Substances
Grants and funding
LinkOut - more resources
Full Text Sources
Other Literature Sources
