. 2011 Dec 9;286(49):42381-42389.
doi: 10.1074/jbc.M111.259689. Epub 2011 Oct 17.

Terminal uridyltransferase enzyme Zcchc11 promotes cell proliferation independent of its uridyltransferase activity

Affiliations

Terminal uridyltransferase enzyme Zcchc11 promotes cell proliferation independent of its uridyltransferase activity

Matthew T Blahna et al. J Biol Chem. .

Abstract

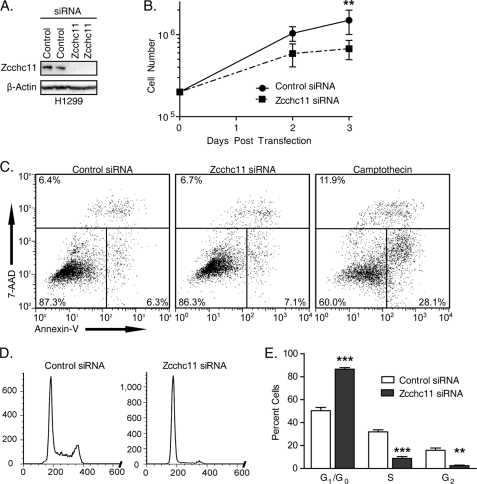
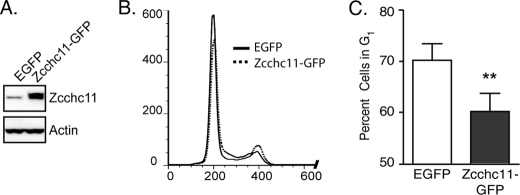
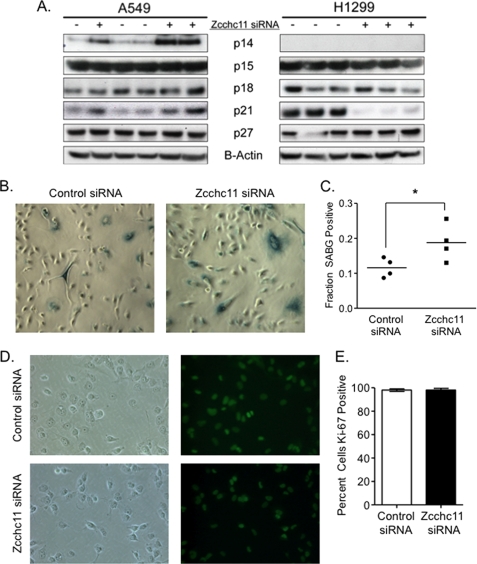
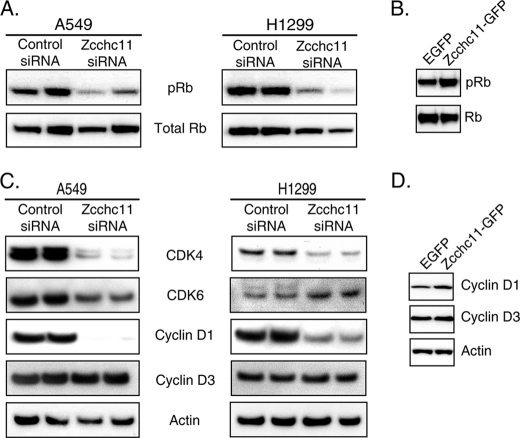
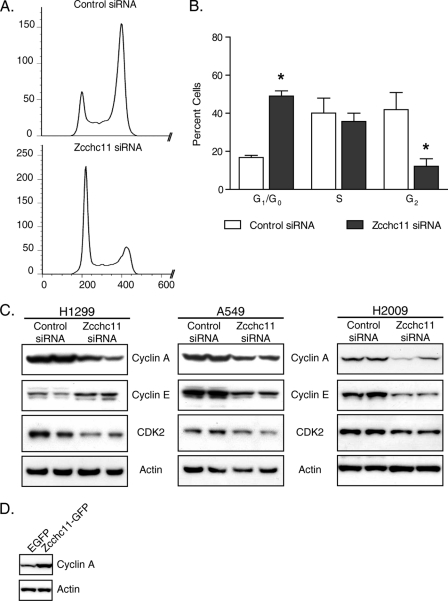
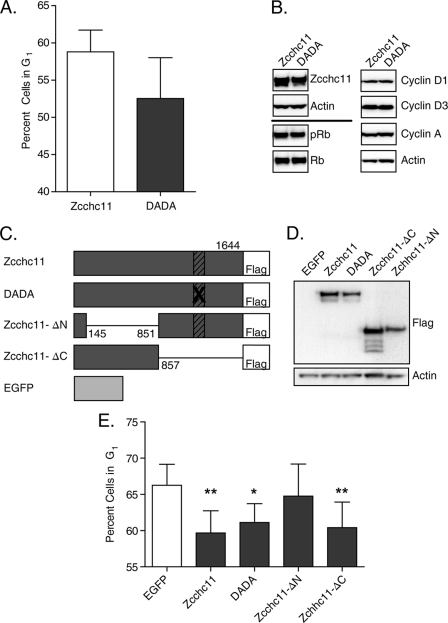
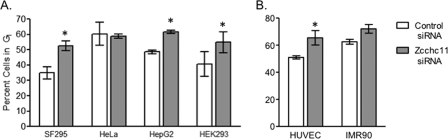
Zcchc11 is a uridyltransferase protein with enzymatic activity directed against diverse RNA species. On the basis of its known uridylation targets, we hypothesized that Zcchc11 might regulate cell proliferation. Confirming this, loss-of-function and complementary gain-of-function experiments consistently revealed that Zcchc11 promotes the transition from G(1) to S phase of the cell cycle. This activity takes place through both Rb-dependent and Rb-independent mechanisms by promoting the expression of multiple G(1)-associated proteins, including cyclins D(1) and A and CDK4. Surprisingly, a Zcchc11 construct with point mutations inactivating the uridyltransferase domain enhanced cell proliferation as effectively as wild-type Zcchc11. Furthermore, truncated mutant constructs revealed that the cell cycle effects of Zcchc11 were driven by the N-terminal region of the protein that lacks the RNA-binding domains and uridyltransferase activity of the full protein. Therefore, the N-terminal portion of Zcchc11, which lacks nucleotidyltransferase capabilities, is biologically active and mediates a previously unrecognized role for Zcchc11 in facilitating cell proliferation.


Figures

FIGURE 1.
FIGURE 1.
Zcchc11 knockdown inhibits cell proliferation in lung epithelial lines. A, immunoblot of cell lysates 48 h after transfection with Zcchc11-targeting or control siRNA. B, cell counts of H1299 cells transfected with the indicated siRNAs. Error bars represent S.E. from three experiments. **, p < 0.01 by matched-pair two-way analysis of variance with the Bonferroni post hoc analysis. C, staining with annexin V and 7-aminoactinomycin D (7-AAD) following treatment with control or Zcchc11-targeting siRNA or with camptothecin (positive control). Numbers indicate the percentage of cells in each section. D, genomic DNA content, as measured by PI staining, of H1299 cells following siRNA treatment. E, estimates of the percentage of H1299 cells in each phase of the cell cycle measured by PI staining. Error bars represent S.E. from six experiments. **, p < 0.01; ***, p < 0.001.
FIGURE 2.
FIGURE 2.
Overexpression of Zcchc11 promotes G1 exit in lung epithelial cells. A, representative immunoblots for Zcchc11 and actin in cell lysates from H1299 cells following transfection with plasmids encoding either EGFP or Zcchc11-GFP. B, overlay of PI staining of H1299 cells transfected with the indicated plasmids. C, estimates of the percentage of cells in G1 following treatment with the same plasmids. Error bars indicate S.E. from four experiments. **, p < 0.01 by Student's matched-pair t test.
FIGURE 3.
FIGURE 3.
Knockdown of Zcchc11 delays passage through G1 arrest but does not induce replicative arrest. A, immunoblotting of whole cell lysates from H1299 and A549 cells treated with control or Zcchc11-targeting siRNA was used to assess the impact of Zcchc11 expression on the levels of common G1 inhibitors. p16INK4 was not detectable in either cell line. B, SABG staining of A549 cells following treatment with control or Zcchc11-targeting siRNA. C, quantification of the percentage of A549 cells staining SABG-positive. *, p < 0.05 by Student's matched-pair t test (n = 3). D, immunofluorescence of Ki67 expression in H1299 cells following siRNA treatment. E, quantification of the percentage of cells staining positive for Ki67 expression in H1299 cells (as in D). Error bars represent S.E. from three separate experiments.
FIGURE 4.
FIGURE 4.
Phosphorylation of Rb is regulated by Zcchc11 in lung epithelial cells. A and C, immunoblots of whole cell lysates from H1299 and A549 cells 48 h after transfection with Zcchc11-targeting or control siRNA. B and D, immunoblots from H1299 cells 24 h after transfection with plasmids encoding either EGFP or mouse Zcchc11-GFP.
FIGURE 5.
FIGURE 5.
Rb-independent regulation of passage through the G1 checkpoint by Zcchc11. A, genomic DNA content of H2009 cells following treatment with control or Zcchc11-targeting siRNA and nocodazole to arrest proliferating cells in G2. B, estimated percentage of H2009 cells in each stage of the cell cycle following siRNA and nocodazole treatment as in A. Error bars represent S.E. from three experiments. *, p < 0.05 by two-way analysis of variance with the Bonferroni post hoc test. C, immunoblots of late G1 proteins from H1299, A549, and H2009 cells treated with control or Zcchc11-targeting siRNA. D, representative immunoblot of H1299 cells transfected with either EGFP or Zcchc11-GFP.
FIGURE 6.
FIGURE 6.
Zcchc11-mediated regulation of the cell cycle is independent of its uridyltransferase activity. A, the percentage of H1299 cells in G1 following transfection with either wild-type or DADA mutant Zcchc11 was estimated by staining genomic DNA with PI. Error bars represent S.E. from four experiments. There was no significant difference between groups by Student's matched-pair t test. B, representative immunoblots of H1299 cell lysates following transfection with FLAG-tagged wild-type or DADA mutant Zcchc11 plasmids. C, schematic representation of the mutant Zcchc11 constructs used to assess the impact of specific regions on G1 exit. Hatched boxes indicate the uridyltransferase domain. D, immunoblot of H1299 cells transfected with the indicated mutant Zcchc11 proteins. E, estimated percentage of H1299 cells in G1 following transfection with the indicated plasmids. Error bars represent S.E. from four experiments. *, p < 0.05; **, p < 0.01 by one-way matched-pair analysis of variance with a Bonferroni correction for multiple comparisons.
FIGURE 7.
FIGURE 7.
Modulation of Zcchc11 affects cell cycle progression in diverse cell types. The percentage of cells remaining in G1 following Zcchc11 knockdown with siRNA was estimated for a diverse set of immortalized cell lines (A) and normal cells (B). *, p < 0.05 versus treated control cells by two-way analysis of variance with Bonferroni adjustment for multiple comparisons. Data shown for each cell type are representative of three separate experiments.

References

    1. Jones M. R., Quinton L. J., Blahna M. T., Neilson J. R., Fu S., Ivanov A. R., Wolf D. A., Mizgerd J. P. (2009) Nat. Cell Biol. 11, 1157–1163 - PMC - PubMed
    1. Schultz J., Lorenz P., Gross G., Ibrahim S., Kunz M. (2008) Cell Res. 18, 549–557 - PubMed
    1. Heo I., Joo C., Kim Y. K., Ha M., Yoon M. J., Cho J., Yeom K. H., Han J., Kim V. N. (2009) Cell 138, 696–708 - PubMed
    1. Stevenson A. L., Norbury C. J. (2006) Yeast 23, 991–1000 - PubMed
    1. Hagan J. P., Piskounova E., Gregory R. I. (2009) Nat. Struct. Mol. Biol. 16, 1021–1025 - PMC - PubMed

Publication types

LinkOut - more resources