. 2011 Oct 17;195(2):293-305.
doi: 10.1083/jcb.201108005.

Spatial constraints dictate glial territories at murine neuromuscular junctions

Affiliations

Spatial constraints dictate glial territories at murine neuromuscular junctions

Monika S Brill et al. J Cell Biol. .

Abstract

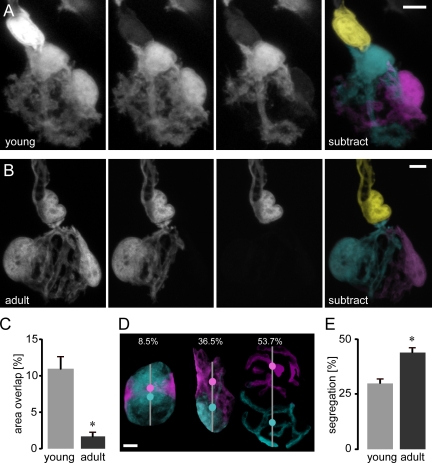
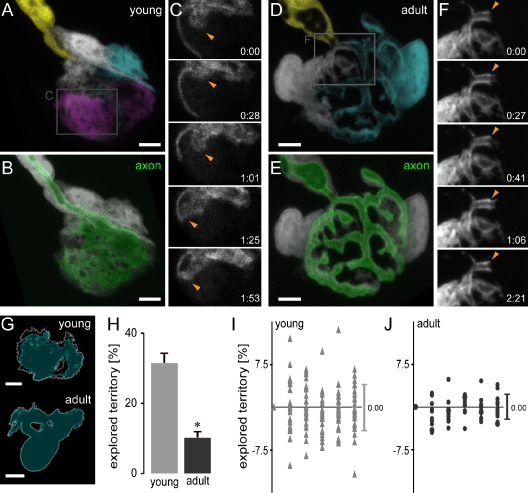
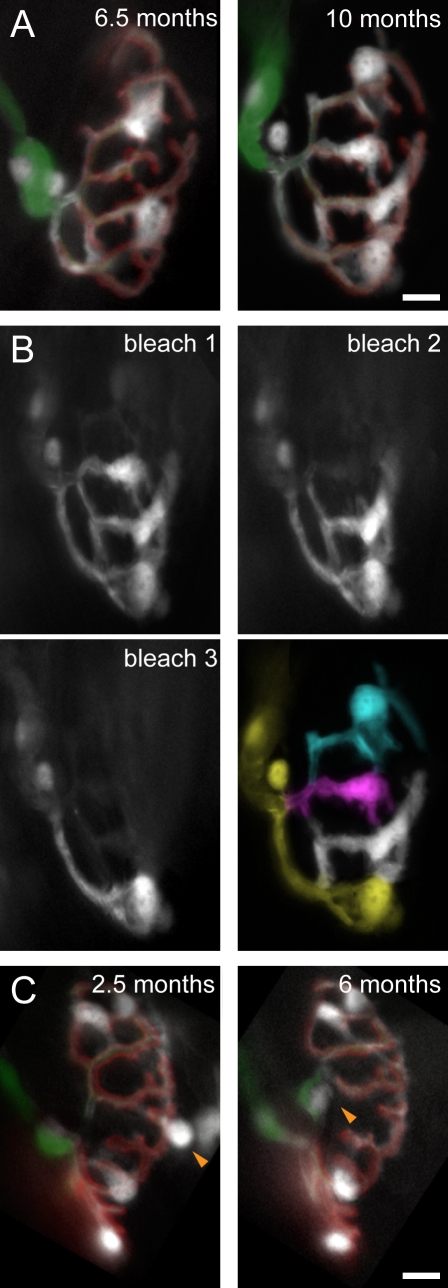
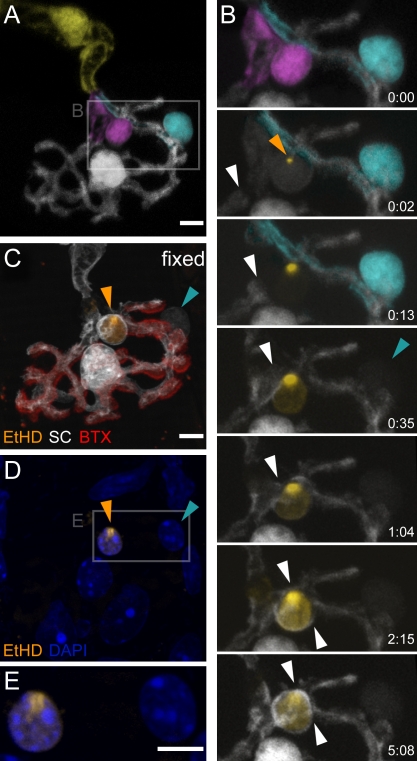
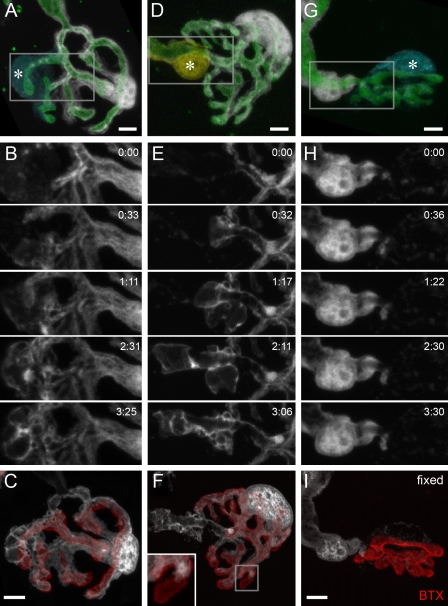
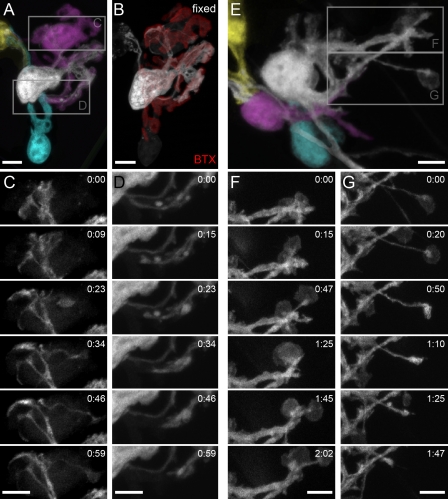
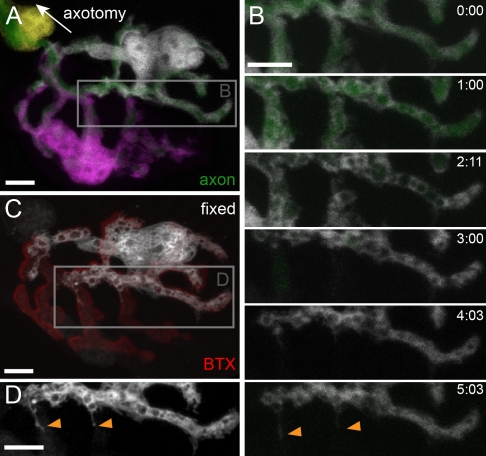
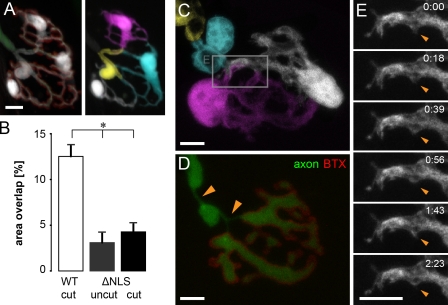
Schwann cells (SCs), the glial cells of the peripheral nervous system, cover synaptic terminals, allowing them to monitor and modulate neurotransmission. Disruption of glial coverage leads to axon degeneration and synapse loss. The cellular mechanisms that establish and maintain this coverage remain largely unknown. To address this, we labeled single SCs and performed time-lapse imaging experiments. Adult terminal SCs are arranged in static tile patterns, whereas young SCs dynamically intermingle. The mechanism of developmental glial segregation appears to be spatial competition, in which glial-glial and axonal-glial contacts constrain the territory of single SCs, as shown by four types of experiments: (1) laser ablation of single SCs, which led to immediate territory expansion of neighboring SCs; (2) axon removal by transection, resulting in adult SCs intermingling dynamically; (3) axotomy in mutant mice with blocked axon fragmentation in which intermingling was delayed; and (4) activity blockade, which had no immediate effects. In summary, we conclude that glial cells partition synapses by competing for perisynaptic space.


Figures

Figure 1.
Figure 1.
Mature segregated terminal SC territories develop from initial glial intermingling. (A and B) Sequential photobleaching of terminal SCs in P11 young (A) and adult (B) nerve–muscle explants from SC-GFP mice. Sequential bleaching steps are depicted in the middle two panels; subtracted and pseudocolored merges of confocal images are shown in the rightmost panels. (C) Terminal SC area overlap as a percentage of total synaptic (BTX positive) area (young: 11.0 ± 1.5%, n = 30 SC pairs, 10 triangularis sterni muscles; adult: 1.7 ± 0.4%, n = 26 SC pairs, 9 triangularis sterni muscles; *, P < 0.01 using a t test; data are represented as the mean of SC pairs + SEM). (D and E) Terminal SC segregation at young versus mature ages. (D) Three examples are shown: an extensively intermingled young SC pair (8.5% minimum), an intermediate example (36.5%), and a mature highly segregated terminal SC pair (53.7%; maximum segregation index measured). Color-coded dots indicate centroids of individual SCs, and lines indicate the length of the NMJ at the axis through the centroids. (E) Quantification of age-dependent segregation (calculated as the distance of the centroids over the length of the NMJ): young (P7–11; 30.4 ± 1.6%, n = 24 SC pairs, six triangularis sterni muscles) versus adult (44.6 ± 1.3%, n = 23 SC pairs, three triangularis sterni muscles; mean of SC pairs + SEM; *, P < 0.01 using a t test). Bars, 5 µm.
Figure 2.
Figure 2.
Immature SCs are highly dynamic, whereas adult SCs are static. (A–F) Confocal time-lapse microscopy of young (A–C) and adult (D–F) SC-GFP terminal SCs in nerve–muscle explants. (A and D) Sequentially bleached young (A) and adult (D) NMJs with pseudocolored terminal and axonal SCs. (B and E) NMJ labeled for axons (thy1-Membow13) and SCs (white). (C and F) Time-lapse recordings over ∼2 h (areas boxed in A and D). Immature terminal SCs were highly dynamic (C; arrowheads), whereas only minor growth or retraction was observed in the adult (F), especially at contact sites with neighboring cells (arrowheads). (G and H) Quantitative analysis of SC dynamism. (G) Example of individual young and adult terminal SC showing mean area covered (cyan) and maximum territory covered (white outline). (H) Quantification of explored territory within 1 h (young: 31.4 ± 2%, n = 24 individual SCs, eight triangularis sterni explants vs. adult: 10.2 ± 1%, n = 14 individual SCs, six triangularis sterni explants; values are normalized to terminal SC size; *, P < 0.001 using a t test; data are represented as the mean of SCs + SEM). (I and J) Territory exploration plotted over a period of 1 h for young (I) and adult (J) terminal SCs (territory difference per 10 min plotted; bars on the right show the mean ± SD; total territories stay stable for 1 h; change −0.45 µm2 for young and −0.28 µm2 for adult terminal SCs, shown normalized to SC size in the figure). The timers shown represent hours/minutes. Bars, 5 µm.
Figure 3.
Figure 3.
Chronic in vivo imaging of mature terminal SCs. (A and B) In vivo images of the same NMJs in the sternomastoid muscle of living SC-GFP mice obtained several weeks apart (interval 2.2 ± 1.0 mo; age at onset of imaging: 4.7 ± 1.1 mo, n = 53 adult NMJs, 10 mice). AChRs were labeled with a nonblocking concentration of BTX (red). Axons are labeled with thy1-CFP (green). (A) Addition of terminal SCs. NMJ with two terminal SCs at 6.5 mo and four terminal SCs at 10 mo. (B) Territory reconstruction of individual terminal SCs from A based on photobleaching in the living animal (bleach 1–3) reveals two new terminal SCs with substantial synaptic territory. (C) Translocation of terminal SCs. NMJ at 2.5 mo with five terminal SCs, one of which translocates across the synapse during the following 3.5 mo (orange arrowheads). Bars, 5 µm.
Figure 4.
Figure 4.
Ablation of adult terminal SCs in the presence of EtHD. (A) A pseudocolored adult NMJ with three terminal SCs (white, magenta, and cyan). (B) Time-lapse recording of area boxed in A over a period of 5 h showing a two-photon laser–induced ablation of the magenta-colored terminal SC in the presence of EtHD (orange arrowhead indicates the site of EtHD influx). After ablation of the magenta SC, the cyan cell was photobleached (cyan arrowhead). Note the absence of EtHD influx in the bleached terminal SC and the expansion (white arrowheads) of the unbleached (white) terminal SC. (C and D) Confocal view of the same NMJ after fixation and counterstaining with BTX (C) and DAPI (D). The nucleus of the ablated terminal SC is filled with EtHD (orange arrowheads in C and D), whereas the bleached terminal SC is not (cyan arrowheads in C and D). (E) Higher magnification of boxed area in D. The timers shown represent hours/minutes. Bars, 5 µm.
Figure 5.
Figure 5.
Terminal SC territories are constrained by neighboring SCs at adult NMJs. (A–C) Two-photon laser–induced ablation (A) of a terminal SC (cyan; asterisk) followed by time-lapse visualization (B) of a neighboring intact terminal SC (white) of the boxed area in A. (C) Post hoc confocal analysis after BTX (red) labeling shows complete coverage of vacated territory by the remaining terminal SC. The axon (labeled by thy1-Membow; green in A) remained intact (not depicted; Video 4). (D–F) Ablation (D) of axonal SC (yellow; asterisk) and time-lapse recording (E) of terminal SC (white). Confocal analysis (F) shows expansion of terminal SC along the axon (labeled by thy1-Membow; green in D; red [BTX] in F). (F, inset) Small postsynaptic area that was vacated during expansion (higher magnification view of boxed area). (G–I). Ablation (G) of terminal SC (cyan; asterisk) and time-lapse recording (H) of adjacent axonal SC. No takeover of territory or phagocytic activity was observed, as confirmed by confocal analysis after fixation (I; axon shown in green in G, labeled by thy1-OFP3; BTX in I). The timers shown represent hours/minutes. Bars, 5 µm.
Figure 6.
Figure 6.
SC segregation is axon dependent. (A–D) Single-cell labeling of an NMJ 31 h after transection of the intercostal nerve. (A and B) Terminal SCs overlap but remain restricted within the synaptic gutter (labeled in B with BTX). (C and D) Time-lapse recording spanning 1 h demonstrates rapid growth (C) and retraction (D) of terminal SC processes within the synaptic gutter (depicted areas boxed in A). (E–G) 5 d after nerve transcection, terminal SCs have started to sprout beyond the synapse. (F and G) Terminal SCs exhibit extrasynaptic growth cone–like structures, which grow (F) and collapse (G) rapidly over a period of 1–2 h (depicted areas boxed in E). The timers shown represent hours/minutes. Bars, 5 µm.
Figure 7.
Figure 7.
Acute axon removal causes delayed SC expansion. (A) NMJ with single-cell labeling before two-photon laser–induced axonal degeneration (SCs pseudocolored in white, magenta, and yellow). The axon was severed at the second node of Ranvier away from the synapse (white arrow indicating direction; not in frame). (B) Time-lapse recording over a period of 5 h shows AAD (note fragmentation after 1 h), which led to local SC outgrowth (orange arrowheads; shown in area boxed in A). (C and D) Fixation after 5 h and staining for BTX reveal local outgrowth along several NMJ branches (orange arrowheads in D show fixed SC channel only in the area boxed in C). The timers shown represent hours/minutes. Bars, 5 µm.
Figure 8.
Figure 8.
SC segregation is activity independent but requires axonal presence. (A) Block of neurotransmission by BoTX treatment did not alter morphology of SCs after 3–4 d. Axon (green), synaptic gutter (BTX [red]) and SCs (white [left] and individually pseudocolored [right]). (B–E) Mice with delayed axon fragmentation (ΔNLS) do not show SC intermingling for up to 2 d after transection. (B) Quantification of area overlap after axotomy in ΔNLS mice (mean of SCs + SEM; *, P < 0.01 using a t test; ΔNLS cut, n = 36 SC pairs, three triangularis sterni muscles; ΔNLS uncut, n = 20 SC pairs, three triangularis sterni muscles; WT cut, n = 31 SC pairs, seven triangularis sterni muscles). (C) Single-cell labeling of an NMJ 2 d after axotomy shows segregated SCs and a preserved axon (D) on top of the synaptic gutter (BTX). Despite preserved axon continuity, local axon atrophy was observed (orange arrowheads in D). (E) Time-lapse microscopy over a period of >2 h demonstrates the lack of terminal SC dynamism at axotomized ΔNLS NMJs (shown in the area boxed in C). The timers shown represent hours/minutes. Bars, 5 µm.

References

    1. Araque A., Parpura V., Sanzgiri R.P., Haydon P.G. 1999. Tripartite synapses: glia, the unacknowledged partner. Trends Neurosci. 22:208–215 10.1016/S0166-2236(98)01349-6 - DOI - PubMed
    1. Awasaki T., Ito K. 2004. Engulfing action of glial cells is required for programmed axon pruning during Drosophila metamorphosis. Curr. Biol. 14:668–677 10.1016/j.cub.2004.04.001 - DOI - PubMed
    1. Barres B.A. 2008. The mystery and magic of glia: a perspective on their roles in health and disease. Neuron. 60:430–440 10.1016/j.neuron.2008.10.013 - DOI - PubMed
    1. Beirowski B., Babetto E., Gilley J., Mazzola F., Conforti L., Janeckova L., Magni G., Ribchester R.R., Coleman M.P. 2009. Non-nuclear Wld(S) determines its neuroprotective efficacy for axons and synapses in vivo. J. Neurosci. 29:653–668 10.1523/JNEUROSCI.3814-08.2009 - DOI - PMC - PubMed
    1. Birks R., Katz B., Miledi R. 1960. Physiological and structural changes at the amphibian myoneural junction, in the course of nerve degeneration. J. Physiol. 150:145–168 - PMC - PubMed

Publication types