. 2011 Oct 24;208(11):2305-20.
doi: 10.1084/jem.20110345. Epub 2011 Oct 17.

DOCK8 deficiency impairs CD8 T cell survival and function in humans and mice

Affiliations

DOCK8 deficiency impairs CD8 T cell survival and function in humans and mice

Katrina L Randall et al. J Exp Med. .

Abstract

In humans, DOCK8 immunodeficiency syndrome is characterized by severe cutaneous viral infections. Thus, CD8 T cell function may be compromised in the absence of DOCK8. In this study, by analyzing mutant mice and humans, we demonstrate a critical, intrinsic role for DOCK8 in peripheral CD8 T cell survival and function. DOCK8 mutation selectively diminished the abundance of circulating naive CD8 T cells in both species, and in DOCK8-deficient humans, most CD8 T cells displayed an exhausted CD45RA(+)CCR7(-) phenotype. Analyses in mice revealed the CD8 T cell abnormalities to be cell autonomous and primarily postthymic. DOCK8 mutant naive CD8 T cells had a shorter lifespan and, upon encounter with antigen on dendritic cells, exhibited poor LFA-1 synaptic polarization and a delay in the first cell division. Although DOCK8 mutant T cells underwent near-normal primary clonal expansion after primary infection with recombinant influenza virus in vivo, they showed greatly reduced memory cell persistence and recall. These findings highlight a key role for DOCK8 in the survival and function of human and mouse CD8 T cells.


Figures

Figure 1.
Figure 1.
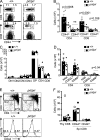
DOCK8 deficiency severely perturbs differentiation and proliferation of naive and memory human T cells. PBMCs from normal donors or DOCK8-deficient patients were analyzed. (A and B) Representative FACS plots and quantitation of total CD8 T cells and naive (CD45RA+CCR7+), memory (CD45RACCR7), and TEMRA (effector memory CD45+ [CD45RA+CCR7]) cell subsets. The FACS plots in A show one representative normal donor and one DOCK8-deficient patient, whereas the graphs in B show data for all samples analyzed, with the horizontal bars representing the mean frequency of cells with the indicated phenotype. (C) CD8 naive, memory, and TEMRA T cells were isolated from normal donors and patients 1 and 2 (red histograms), labeled with CFSE, and then stimulated with TAE beads in the absence or presence of exogenous IL-2. Cell division was determined after 5 d by measuring dilution of CFSE. (D and E) Representative FACS plots and quantitation of total CD4 T cells and naive (CD45RA+CCR7+), memory (CD45RACCR7), and TEMRA (CD45RA+CCR7) cell subsets. The FACS plots in D show one normal donor and one DOCK8-deficient patient, whereas the graphs in E show data for all samples analyzed, with the horizontal bars representing the mean frequency of cells with the indicated phenotype. (F and G) CD4+ naive (left) and memory (right) T cells were isolated from normal donors and patients 1 (F) and 2 (G; red histograms), labeled with CFSE, and then stimulated with TAE beads in the absence of presence of exogenous IL-2. Cell division was determined after 5 d by measuring dilution of CFSE. Significant differences were determined by the Student’s t test.
Figure 2.
Figure 2.
Phenotypic analysis of human DOCK8-deficient CD8+ T cells. (A–E) PBMCs from normal donors (n = 9) or DOCK8-deficient patients (n = 4) were labeled with anti-CD8, anti-CD45RA, and anti-CCR7 mAbs and either isotype control or mAb specific for CD28, CD57, CD95, CD127 (IL-7Ra), and CX3CR1. The expression of these molecules on naive (CD45RA+CCR7+), memory (CD45RACCR7), and TEMRA (CD45RA+CCR7) cell subsets of CD8 T cells was then determined. The histogram plots are from one representative normal donor or control. Each value in the graphs corresponds to an individual normal donor or patient; the horizontal bars represent the mean.
Figure 3.
Figure 3.
Analysis of T cells in Dock8pri/pri mice. (A) Representative flow cytometry plots of T cells in the spleen of Dock8pri/pri and C57BL/6 (+/+) mice. (B–D) Quantitation of T cells in spleen (B) and various subsets of thymic T cells (C and D) for age-matched C57BL/6 and Dock8pri/pri mice. Bars are means, error bars indicate SEM, and dots indicate individual mice. Statistical analysis was performed by the unpaired Student’s t test with Welch’s correction. Data are representative of three independent experiments. (E) Representative flow cytometry plots of thymic (top) and splenic (bottom) cells from OT-I mice. (F) Quantitation of thymic and splenic CD8 T cells in WT and mutant OT-I mice. Bars are medians, and dots indicate individual mice.
Figure 4.
Figure 4.
Analysis of bone marrow chimeras. Bone marrow chimeras were reconstituted with 50% Dock8pri/pri CD45.2+ and 50% WT CD45.1+ bone marrow. Controls were reconstituted with 50% WT CD45.2 and 50% WT CD45.1 bone marrow. (A) Percentage of CD45.2+ cells reconstituting the cellular subsets shown in these bone marrow chimeras. Each bar is the percent reconstitution of a cell subset in an individual mouse (indicated by the number below the bar). Data are representative of two independent experiments. DN, double negative; DP, double positive. (B) Representative flow cytometry plots and quantitation of CD44 expression on CD45.2+ pri/pri and WT (+/+) cells from chimeras as in A. Bars are means, error bars indicate SEM, and dots indicate individual mice.
Figure 5.
Figure 5.
Survival of naive Dock8pri/pri T cells. WT (CD45.1/CD45.2) and Dock8pri/pri (CD45.1) spleen cells were adoptively cotransferred into normal C57BL/6 mice (CD45.2). (A) Representative flow cytometry plots showing the percentage of adoptively transferred CD8 T cells at various time points after transfer. Numbers indicate the percentage of cells in the gate as a percentage of total spleen cells. (B) Quantitation of adoptively transferred CD8 T cells in two separate experiments using polyclonal T cells (top two panels) and one experiment using OT-I transgenic T cells (bottom). Data are representative of two separate experiments for each cell type. **, P < 0.01 for χ2 test compared with input percentages.
Figure 6.
Figure 6.
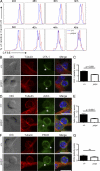
Dock8pri/pri OT-I T cells show delayed proliferation and a defect in immune synapse formation in response to antigen presentation. (A) Naive WT and pri/pri splenic CD8 T cells were labeled with CFSE and cultured with SIINFEKL-pulsed DCs. Cells were harvested at the indicated time points and analyzed for fluorescent intensity of CFSE by flow cytometry. Data are representative of five independent experiments. (B–G) Naive WT and pri/pri splenic CD8 T cells were co-cultured with preadhered SIINFEKL-pulsed DCs for 1 h and fixed for immunofluorescence staining. (B, D, and F) Tubulin (red) staining was used to mark recruitment of the MTOC to the immune synapse along with costaining for the protein of interest (green). Images are representative of three independent experiments. Bars, 10 µm. (C, E, and G) Scoring of LFA-1 (+/+, n = 168; pri/pri, n = 176), actin (+/+, n = 70; pri/pri, n = 77), and PKC-θ (+/+, n = 50; pri/pri, n = 46) recruitment to the interface between the T cell and DC (marked by asterisks). Bars are mean, and error bars indicate SD. Scoring was performed blind as per Materials and methods. Statistical analysis was performed by the Student’s t test.
Figure 7.
Figure 7.
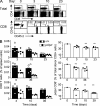
Pairwise analysis of persistence of Dock8pri/pri CD8 T cells after viral challenge. OT-I (Vα2+) T cells with either WT or mutant DOCK8 were mixed in a defined ratio and cotransferred into C57BL/6 mice, which were then injected i.p. with modified influenza virus (first HKx31-SIINFEKL and then PR8-SIINFEKL), as indicated by the black arrows. (A) Representative flow cytometry plots showing identification of transferred cells at various time points. Control indicates no adoptive transfer. (B) Time course of adoptive transfer and infection. Graphs show numbers of transferred WT (open) and Dock8pri/pri (closed) cells at various time points within the same recipient mouse (top) and percentage contribution of mutant cells to total donor cells within spleen (open), peritoneum (closed), and bone marrow (striped; bottom). For the bottom panel, bars are means, and error bars indicate SEM. Data are representative of two independent experiments. (C) Adoptive transfers as in A and B with three experimental groups. Recipients were injected with Dock8pri/pri and WT (+/+) cells, Dock8pri/+ and WT (+/+) cells, or WT combined with WT cells. Graphs show numbers of transferred WT (open) and either Dock8pri/pri (left), Dock8pri/+ (middle), or WT (right panel; all closed) cells at various time points in the same recipient mouse.
Figure 8.
Figure 8.
Further investigation of the consequences of DOCK8 deficiency for persistence and recall of primed OT-I CD8 T cells. OT-I T cells with either WT or mutant DOCK8 were mixed in a defined ratio and cotransferred into C57BL/6 mice, which were then injected i.p. with modified influenza virus, as indicated by the black arrows. (A) Overlay histograms of the expression of surface markers on WT (black) and Dock8pri/pri (red) donor and recipient (gray) CD8 T cells at the indicated time points after adoptive transfer. (B) Longitudinal time course of adoptive transfer and infection. Graphs show percentages of transferred WT (blue) and Dock8pri/pri (red) OT-I CD8 T cells in blood at various time points within the same recipient mouse (denoted by different symbols; top) and percent contribution of mutant cells to total donor cells at various time points after adoptive transfer (bottom). Bars are medians, and dots indicate individual mice. Results of one independent experiment are shown.

References

    1. Appay V., van Lier R.A.W., Sallusto F., Roederer M. 2008. Phenotype and function of human T lymphocyte subsets: consensus and issues. Cytometry A. 73:975–983 - PubMed
    1. Atherton D.J., Gennery A.R., Cant A.J. 2004. The neonate. Rook’s Textbook of Dermatology, Vol. 1. Seventh edition Burns T., Breathnach S., Cox N., Griffiths C., Blackwell Publishing, Carlton, Australia: 14:66–14:67
    1. Bachmann M.F., Beerli R.R., Agnellini P., Wolint P., Schwarz K., Oxenius A. 2006. Long-lived memory CD8+ T cells are programmed by prolonged antigen exposure and low levels of cellular activation. Eur. J. Immunol. 36:842–854 10.1002/eji.200535730 - DOI - PubMed
    1. Badour K., Zhang J., Shi F., McGavin M.K., Rampersad V., Hardy L.A., Field D., Siminovitch K.A. 2003. The Wiskott-Aldrich syndrome protein acts downstream of CD2 and the CD2AP and PSTPIP1 adaptors to promote formation of the immunological synapse. Immunity. 18:141–154 10.1016/S1074-7613(02)00516-2 - DOI - PubMed
    1. Beck L.A., Boguniewicz M., Hata T., Schneider L.C., Hanifin J., Gallo R., Paller A.S., Lieff S., Reese J., Zaccaro D., et al. 2009. Phenotype of atopic dermatitis subjects with a history of eczema herpeticum. J. Allergy Clin. Immunol. 124:260–269 10.1016/j.jaci.2009.05.020 - DOI - PMC - PubMed

Publication types

MeSH terms

Substances