. 2011 Dec;134(Pt 12):3742-54.
doi: 10.1093/brain/awr263. Epub 2011 Oct 17.

Functional connectivity magnetic resonance imaging classification of autism

Affiliations

Functional connectivity magnetic resonance imaging classification of autism

Jeffrey S Anderson et al. Brain. 2011 Dec.

Abstract

Group differences in resting state functional magnetic resonance imaging connectivity between individuals with autism and typically developing controls have been widely replicated for a small number of discrete brain regions, yet the whole-brain distribution of connectivity abnormalities in autism is not well characterized. It is also unclear whether functional connectivity is sufficiently robust to be used as a diagnostic or prognostic metric in individual patients with autism. We obtained pairwise functional connectivity measurements from a lattice of 7266 regions of interest covering the entire grey matter (26.4 million connections) in a well-characterized set of 40 male adolescents and young adults with autism and 40 age-, sex- and IQ-matched typically developing subjects. A single resting state blood oxygen level-dependent scan of 8 min was used for the classification in each subject. A leave-one-out classifier successfully distinguished autism from control subjects with 83% sensitivity and 75% specificity for a total accuracy of 79% (P = 1.1 × 10(-7)). In subjects <20 years of age, the classifier performed at 89% accuracy (P = 5.4 × 10(-7)). In a replication dataset consisting of 21 individuals from six families with both affected and unaffected siblings, the classifier performed at 71% accuracy (91% accuracy for subjects <20 years of age). Classification scores in subjects with autism were significantly correlated with the Social Responsiveness Scale (P = 0.05), verbal IQ (P = 0.02) and the Autism Diagnostic Observation Schedule-Generic's combined social and communication subscores (P = 0.05). An analysis of informative connections demonstrated that region of interest pairs with strongest correlation values were most abnormal in autism. Negatively correlated region of interest pairs showed higher correlation in autism (less anticorrelation), possibly representing weaker inhibitory connections, particularly for long connections (Euclidean distance >10 cm). Brain regions showing greatest differences included regions of the default mode network, superior parietal lobule, fusiform gyrus and anterior insula. Overall, classification accuracy was better for younger subjects, with differences between autism and control subjects diminishing after 19 years of age. Classification scores of unaffected siblings of individuals with autism were more similar to those of the control subjects than to those of the subjects with autism. These findings indicate feasibility of a functional connectivity magnetic resonance imaging diagnostic assay for autism.


Figures
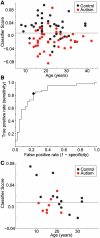
Figure 1
Figure 1
Accuracy of the leave-one-out classifier in the training dataset and replication in an independent sample of families. (A) Scatter plot showing classification scores for leave-one-out classifier in the training dataset for connections selected by P < 0.001. (B) Receiver operating characteristic (ROC) curve showing the optimal compromise between the true positive rate and false positive rate that was the basis for the discriminant threshold. (C) Scatter plot showing classification in the replication sample.
Figure 2
Figure 2
Dependence of classification accuracy on the subset of connections used. Sensitivity, specificity and total accuracy for the classifier is shown for all connections and for the subset of connections selected by a two-tailed t-test with P-values 0.001, 0.0001, 0.00 001 and 0.000 001. Horizontal lines show what per cent of subjects out of 40 would need to be classified correctly to achieve the specified P-value, and apply to sensitivity and specificity bars only.
Figure 3
Figure 3
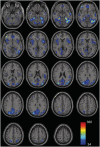
Brain regions most informative for classification. Shaded regions represent regions of interest disproportionately represented among informative connections, with colour scale representing the number of occurrences of the region of interest among the 58 908 most informative connections. Permutation testing demonstrated that if connections were randomly selected from the regions of interest, no region would be represented >33 times in 95% of simulations.
Figure 4
Figure 4
Connectivity differences in autism related to distance between brain regions and strength of correlation. (A) All connections were grouped into bins based on the distance in millimetre between the regions of interest (ROIs) versus the mean Fisher-transformed correlation across all 80 subjects. Within each bin, the two-tailed, two-sample t-score comparing autism and control subjects was averaged across the connections in the bin. Negative correlations were higher in subjects with autism (less anticorrelated), particularly between more distant regions. Strong positive correlations between brain regions were higher in control subjects. (B) Per cent of connections within each bin that were among the 58 908 most informative. (C) Distribution of informative connections with a positive versus negative t-score as a function of mean Fisher-transformed correlation across all subjects. (D) Distribution of informative connections with a positive versus negative t-score as a function of Euclidean distance.
Figure 5
Figure 5
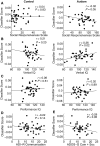
Relationship between functional connectivity classification score and clinical covariates. Scatter plots and best linear fit are shown for functional connectivity MRI classification score as a function of (A) Social Responsiveness Scale, (B) verbal IQ, (C) performance IQ, (D) ADI-R, (E) ADOS-G (social + communication) in autism and control samples. Significant relationships are annotated by correlation values and P-values above the plots.

Similar articles

Cited by

References

    1. Alexander AL, Lee JE, Lazar M, Boudos R, DuBray MB, Oakes TR, et al. Diffusion tensor imaging of the corpus callosum in Autism. Neuroimage. 2007;34:61–73. - PubMed
    1. American Psychiatric Association. Diagnostic and Statistical Manual of Mental Disorders: DSM-IV, 4th edn. Washington, DC: American Psychiatric Association; 1994.
    1. Anderson JS, Dhatt HS, Ferguson MA, Lopez-Larson M, Schrock L, House P, et al. Functional connectivity targeting for deep brain stimulation in essential tremor. AJNR Am J Neuroradiol. 2011a Advance Access published on September 1, 2011, doi:10.3174/ajnr.A2638. - PMC - PubMed
    1. Anderson JS, Druzgal TJ, Froehlich A, DuBray MB, Lange N, Alexander AL, et al. Decreased interhemispheric functional connectivity in autism. Cereb Cortex. 2011b;21:1134–46. - PMC - PubMed
    1. Anderson JS, Druzgal TJ, Lopez-Larson M, Jeong EK, Desai K, Yurgelun-Todd D. Network anticorrelations, global regression, and phase-shifted soft tissue correction. Hum Brain Mapp. 2011c;32:919–34. - PMC - PubMed

Publication types