. 2011 Dec;157(4):1866-83.
doi: 10.1104/pp.111.181883. Epub 2011 Oct 17.

Apoplastic reactive oxygen species transiently decrease auxin signaling and cause stress-induced morphogenic response in Arabidopsis

Affiliations

Apoplastic reactive oxygen species transiently decrease auxin signaling and cause stress-induced morphogenic response in Arabidopsis

Tiina Blomster et al. Plant Physiol. 2011 Dec.

Abstract

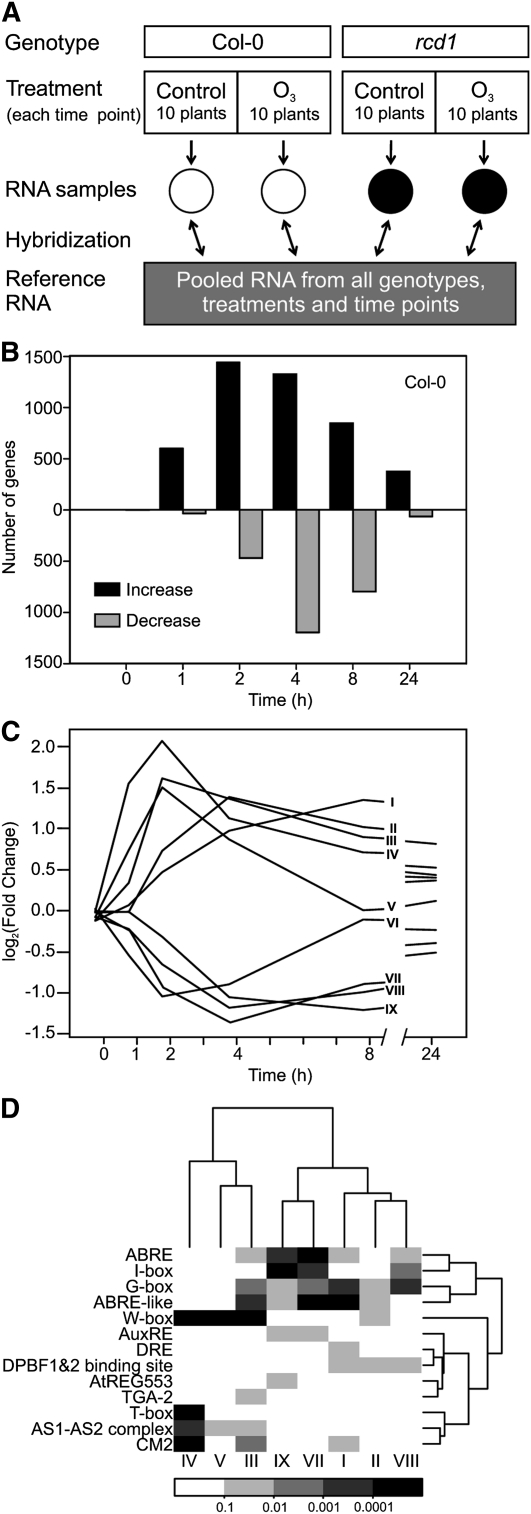
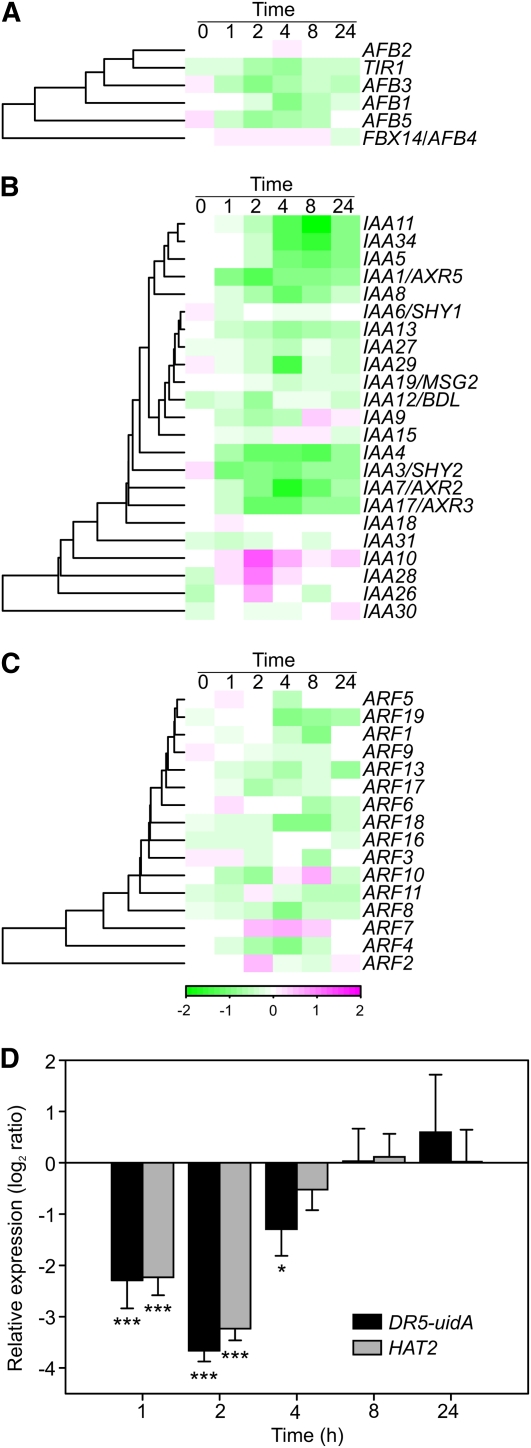
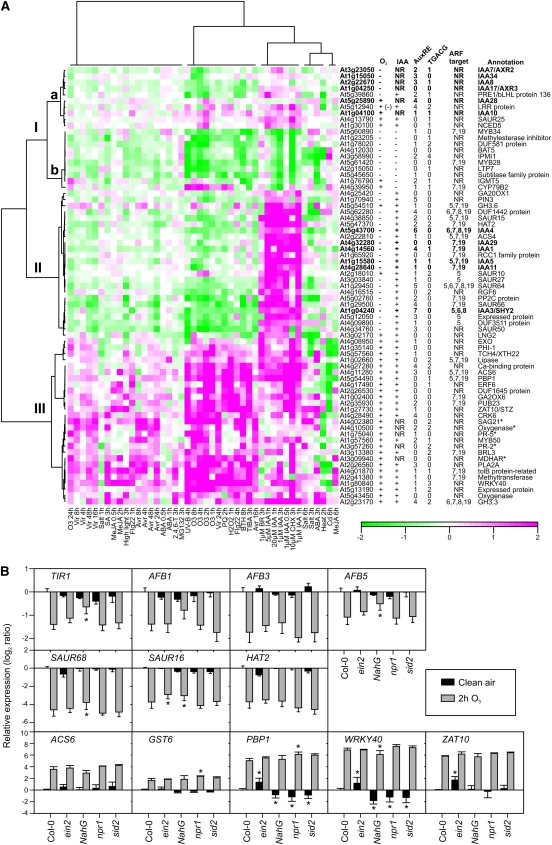
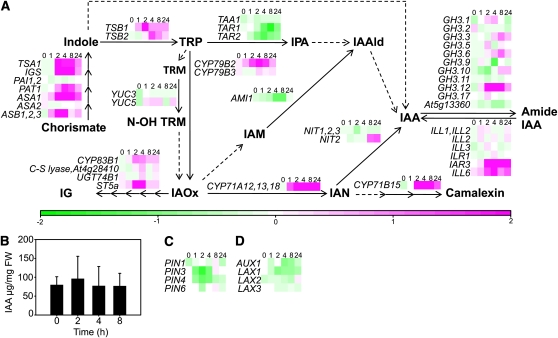
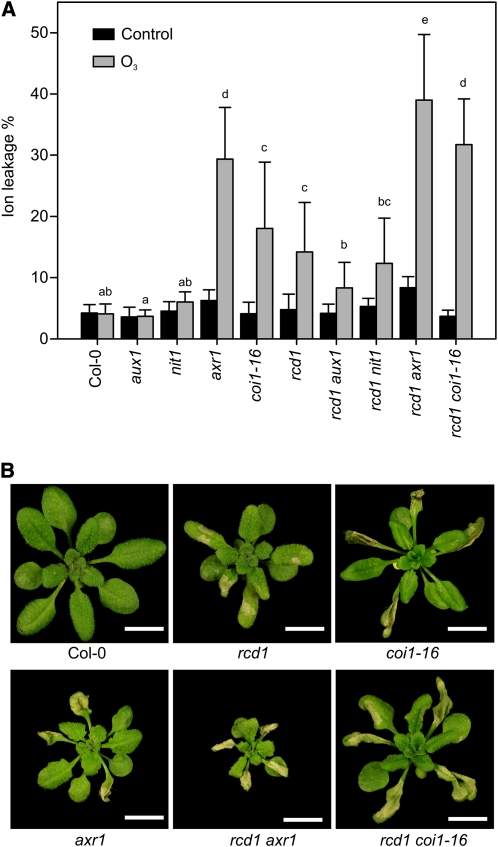
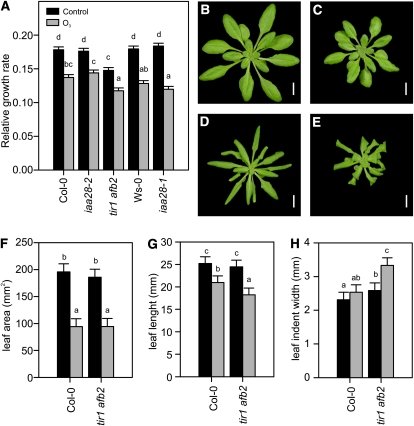
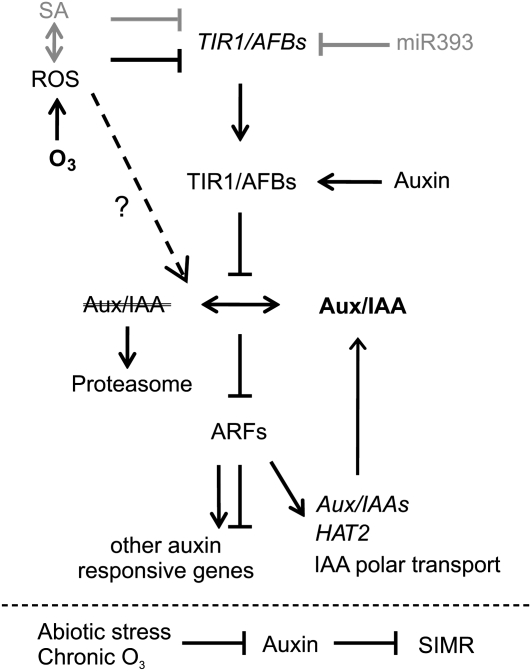
Reactive oxygen species (ROS) are ubiquitous signaling molecules in plant stress and development. To gain further insight into the plant transcriptional response to apoplastic ROS, the phytotoxic atmospheric pollutant ozone was used as a model ROS inducer in Arabidopsis (Arabidopsis thaliana) and gene expression was analyzed with microarrays. In contrast to the increase in signaling via the stress hormones salicylic acid, abscisic acid, jasmonic acid (JA), and ethylene, ROS treatment caused auxin signaling to be transiently suppressed, which was confirmed with a DR5-uidA auxin reporter construct. Transcriptomic data revealed that various aspects of auxin homeostasis and signaling were modified by apoplastic ROS. Furthermore, a detailed analysis of auxin signaling showed that transcripts of several auxin receptors and Auxin/Indole-3-Acetic Acid (Aux/IAA) transcriptional repressors were reduced in response to apoplastic ROS. The ROS-derived changes in the expression of auxin signaling genes partially overlapped with abiotic stress, pathogen responses, and salicylic acid signaling. Several mechanisms known to suppress auxin signaling during biotic stress were excluded, indicating that ROS regulated auxin responses via a novel mechanism. Using mutants defective in various auxin (axr1, nit1, aux1, tir1 afb2, iaa28-1, iaa28-2) and JA (axr1, coi1-16) responses, ROS-induced cell death was found to be regulated by JA but not by auxin. Chronic ROS treatment resulted in altered leaf morphology, a stress response known as "stress-induced morphogenic response." Altered leaf shape of tir1 afb2 suggests that auxin was a negative regulator of stress-induced morphogenic response in the rosette.


Figures

Figure 1.
Figure 1.
Apoplastic ROS-responsive genes in a time series microarray experiment. A, Diagram showing the experimental setup. The experiment described was repeated three times. B, Number of genes with at least 2-fold expression changes (log2 ratio ± 1, q < 0.05) in O3-treated Col-0 compared with control plants per each time point (0, 1, 2, 4, 8, and 24 h). Altogether, 3,635 transcripts were responsive to apoplastic ROS. C, Clustering of genes responsive to apoplastic ROS across all time points identified nine expression profiles. Profiles I to V included genes with mainly increased expression, and profiles VI to IX included genes with mainly decreased expression. D, Promoter motif analysis for the nine expression profiles identified within 500-bp promoters of O3-regulated genes. The color scale represents statistical significance. Motif sequences are provided in Supplemental Table S3.
Figure 2.
Figure 2.
Auxin signaling is altered by apoplastic ROS. A to C, O3 responses (log2 ratio) of TIR1-AFB receptors (A), Aux/IAA genes (B), and ARFs (C). D, Relative expression of DR5-uidA and HAT2 in O3-treated DR5-uidA plants was determined with qPCR. Averages from three biological replicates are shown, and error bars represent sd. Asterisks depict statistically significant differences from 0 (* P < 0.05, *** P < 0.001). DR5-uidA and HAT2 expression levels remained unchanged across time points in clean air (data not shown).
Figure 3.
Figure 3.
Regulation of auxin-related genes by plant hormones and biotic and abiotic stress. A, Clustering of transcripts regulated by auxin and apoplastic ROS. Sixty O3 and auxin-regulated transcripts (log2 ratio ± 1, q < 0.05) were identified from publicly available microarray experiments. In addition, apoplastic ROS-responsive Aux/IAA transcripts and five stress-responsive marker genes not regulated by auxin were included in the analysis (marked with asterisks). The number of AuxRE (TGTCnC) and TGACG elements was calculated within 1,000-bp promoter regions. Putative transcriptional regulation by ARFs is indicated with the corresponding ARF number. +, Increased expression; −, decreased expression; NR, not regulated. B, Expression of selected auxin or apoplastic ROS-regulated genes in Col-0, ein2, NahG, npr1, and sid2 in clean air (black bars) and after 2 h of 350 nL L−1 O3 (gray bars) determined with qPCR. Expression levels are normalized to ACTIN2. Means of two to three biological replicates are shown ± sd. Asterisks depict statistically significant differences from Col-0 in clean air (black bars) and from O3-treated Col-0 (gray bars) at P < 0.05.
Figure 4.
Figure 4.
Apoplastic ROS affects the expression of genes regulating auxin homeostasis without concomitant changes in IAA concentration. A, Expression of IAA biosynthesis genes, IAA amido conjugases, and IAA amido hydrolases. Biosynthesis genes and pathways are according to Normanly (2010): solid arrows indicate reactions with verified catalytic enzymes, whereas dashed arrows represent unknown metabolic steps. Multiple consecutive reactions are depicted with the respective number of arrows. The transcriptional response to apoplastic ROS is presented from all the genes with detectable expression levels. TRP = Trp; TRM = tryptamine; N-OH-TRM = N-hydroxyltryptamine; IPA = indole-3-pyruvic acid; IAAld = indole-3-acetaldehyde; IG = indole-3-methylglucosinolate; IAOx = indole-3-acetaldoxime; IAM = indole-3-acetamide; IAA = indole-3-acetic acid; IAN = indole-3-acetonitrile. All the verified (after Normanly, 2010) and putative genes involved in IAA conjugation (GH3 family) and hydrolysis are shown. B, The concentration of free IAA was quantified from Col-0 plants at 0, 2, 4, and 8 h after the onset of O3 exposure (350 nL L−1; 6 h). The experiment was repeated twice, and one representative experiment is shown. Error bars depict sd (n = 4–5). FW, Fresh weight. C, Expression of auxin efflux carriers is reduced by apoplastic ROS. D, Auxin influx carriers show a slight decrease in response to apolastic ROS.
Figure 5.
Figure 5.
The axr1 mutant is sensitive to apoplastic ROS. A, O3-induced cell death was quantified as ion leakage. Three-week-old Col-0, aux-1, nit1, axr1, coi1-16, and rcd1 together with respective rcd1 double mutants were treated with O3 (6 h; 350 nL L−1) and harvested 8 h after the start of the experiment. Ion leakage was measured from control and O3-treated plants and calculated as percentage of total ions of each plant (n = 5). The experiment was repeated five times, and the results were analyzed with linear mixed models. Values shown represent mean cell death per genotype, and error bars indicate sd. Letters show statistical significance (P < 0.05) from posthoc analysis by computing contrasts from linear mixed models and subjecting the P values to single-step error correction. B, In addition to increased cell death, rcd1 axr1 plants have smaller size, whereas rcd1 coi1-16 plants do not show alterations in plant size compared with the parental lines. Plants were treated with O3 (6 h; 350 nL L−1), and photographs were taken 24 h after the start of the exposure. Bars = 1 cm.
Figure 6.
Figure 6.
Chronic O3 reduces plant growth. A, Two-week-old Col-0, iaa28-2, tir1 afb2, Ws-0, and iaa28-1 plants were exposed to O3 daily (6 h; 350 nL L−1). For growth rate analysis, rosette diameter was determined by finding the minimal circle that contained all leaves using ImageJ image-analysis software (http://rsbweb.nih.gov/ij/) before and after 7 d of O3 exposure. Relative growth rate was calculated by fitting a linear model to plant size (for details, see “Materials and Methods”). B to E, Four-week-old control clean-air and ozone-exposed plants. Under control clean-air conditions, Col-0 plants (B) are larger than tir1 afb2 plants (C), which have constitutively smaller size and slightly curled leaves. After 2 weeks of O3 exposure, Col-0 exhibits stunted growth and curled leaves (D). Leaf curling in response to O3 is more prominent in tir1 afb2 plants (E). Bars = 1 cm. F to H, Leaf shape parameters area (F), length (G), and mean indent width (H) were quantified using the LAMINA software (Bylesjö et al., 2008). All experiments were repeated twice with similar results, and the data were analyzed with linear models. Values shown represent mean relative growth rate, and error bars indicate sd of the linear model (n ≥ 6).
Figure 7.
Figure 7.
The auxin signaling pathway is modulated by apoplastic ROS. The binding of auxin to TIR1/AFB receptors leads to the degradation of AUX/IAA repressors via the 26S proteasome, allowing the activation of ARF transcription factors and changes in gene expression. O3 treatment leads to the production of apoplastic ROS, which could suppress the auxin pathway by decreasing the expression of TIR1/AFBs independently of miR393 and SA. O3 may affect the stability of Aux/IAAs (e.g. IAA10 and IAA28), or ARF activity could be directly modulated independently of auxin F-box proteins. ARFs regulate auxin-dependent gene expression, which includes Aux/IAA transcripts. Decreased levels of Aux/IAA transcripts provide a feedback mechanism counteracting the increased Aux/IAA stability. In addition, apoplastic ROS modulated the expression of several genes involved in auxin signaling, polar transport, and biosynthesis. Chronic O3 exposure leads to SIMR, which is under negative regulation of the auxin signaling pathway.

Similar articles

Cited by

References

    1. Ahlfors R, Brosché M, Kollist H, Kangasjärvi J. (2009) Nitric oxide modulates ozone-induced cell death, hormone biosynthesis and gene expression in Arabidopsis thaliana. Plant J 58: 1–12 - PubMed
    1. Bashandy T, Guilleminot J, Vernoux T, Caparros-Ruiz D, Ljung K, Meyer Y, Reichheld JP. (2010) Interplay between the NADP-linked thioredoxin and glutathione systems in Arabidopsis auxin signaling. Plant Cell 22: 376–391 - PMC - PubMed
    1. Bretz F, Hothorn T, Westfall T. (2010) Multiple Comparisons Using R. CRC Press, Boca Raton, FL
    1. Brosché M, Merilo E, Mayer F, Pechter P, Puzõrjova I, Brader G, Kangasjärvi J, Kollist H. (2010) Natural variation in ozone sensitivity among Arabidopsis thaliana accessions and its relation to stomatal conductance. Plant Cell Environ 33: 914–925 - PubMed
    1. Bylesjö M, Segura V, Soolanayakanahally RY, Rae AM, Trygg J, Gustafsson P, Jansson S, Street NR. (2008) LAMINA: a tool for rapid quantification of leaf size and shape parameters. BMC Plant Biol 8: 82. - PMC - PubMed

Publication types

MeSH terms