

doi: 10.1242/dev.071571.
Epub 2011 Oct 17.
A computational statistics approach for estimating the spatial range of morphogen gradients
Affiliations
- PMID: 22007136
- PMCID: PMC3201657
- DOI: 10.1242/dev.071571
Item in Clipboard
A computational statistics approach for estimating the spatial range of morphogen gradients
Development.
2011 Nov.
Abstract
A crucial issue in studies of morphogen gradients relates to their range: the distance over which they can act as direct regulators of cell signaling, gene expression and cell differentiation. To address this, we present a straightforward statistical framework that can be used in multiple developmental systems. We illustrate the developed approach by providing a point estimate and confidence interval for the spatial range of the graded distribution of nuclear Dorsal, a transcription factor that controls the dorsoventral pattern of the Drosophila embryo.
Figures
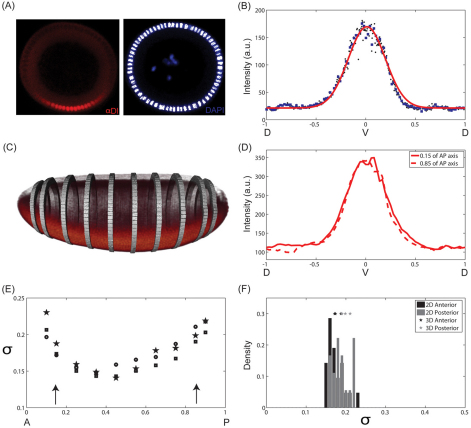
Data collection. (A) End-on imaging: DV cross-section of a Drosophila embryo stained using antibody against Dl (left) and DAPI (right). Ventral side is at the bottom and dorsal side is at the top. The nuclear mask (white) was established based on the DAPI signal. (B) Representative spatial pattern of nuclear Dl (black dots) as a function of DV position. The gradient is interpolated onto a uniform grid (blue squares). As the nuclei are spaced very tightly, linear interpolation does not introduce any artifact to the gradient. Solid red line represents the Gaussian fit that is used to find the ventralmost position along the DV axis. (C) 3D imaging of a Drosophila embryo stained with α-Dl antibody using scanned light sheet-based microscopy. The bands correspond to positions along the AP axis of the embryo where the DV pattern of nuclear Dl was quantified. (D) DV profile of nuclear Dl at 15% (solid) and 85% (dashed) of the AP axis from the anterior pole in one embryo. (E) Gaussian width (σ) of nuclear Dl profile as a function of position along the AP axis for three independent embryos. Arrows indicate the depth at which cross-sectional views are imaged using the microfluidic device. (F) Comparison of the estimated Gaussian widths of nuclear Dl profiles, measured 15% from anterior and posterior poles, obtained by scanned light sheet-based microscopy (3D) with those obtained by end-on imaging in a microfluidic device (2D).
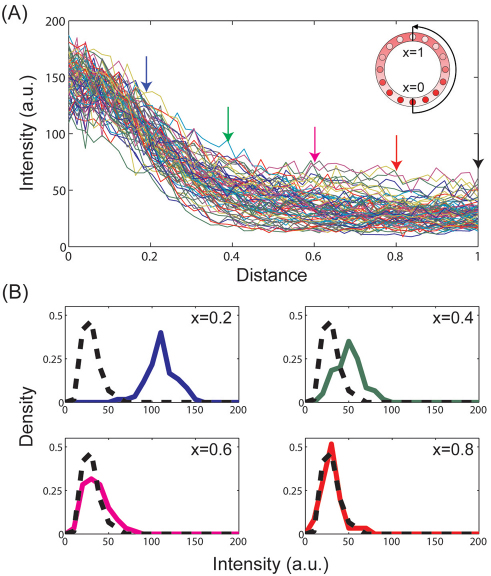
Empirical distributions. (A) Raw intensity measurements of nuclear Dl (36 embryos, 72 nuclear Dl gradients from ventral to dorsal end). 0/1 corresponds to the ventral/dorsal sides of the embryo, respectively. Colored arrows indicate the specific positions at which the empirical distribution functions are shown in B. (B) Empirical distributions of fluorescence intensities at x=0.2, 0.4, 0.6, 0.8 (solid line) compared with the basal level at x=1 (broken black line).
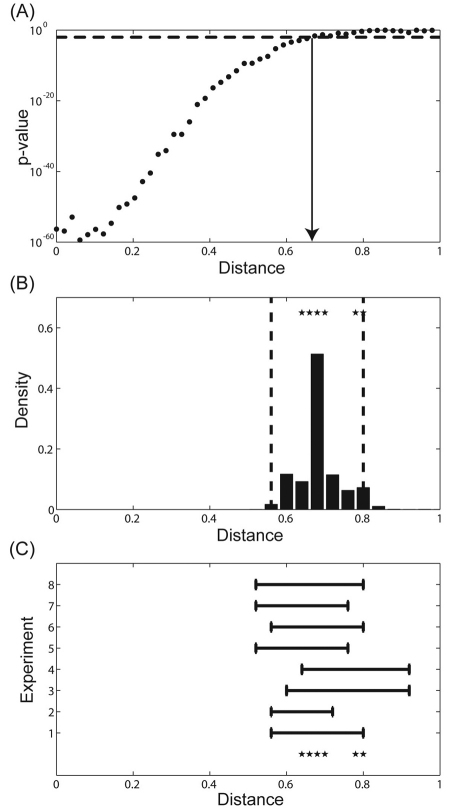
Point estimate and associated confidence interval. (A) P-value for pairwise comparison of the means of the signal intensities at a given position along the DV axis (x) and a baseline value (x=1). Dotted line indicates the cut-off chosen for level of significance. The estimated range of nuclear Dl gradient is indicated by the solid arrow. (B) Probability distribution for the estimated spatial range. Dotted lines indicate the 95% confidence interval. Stars represent the estimated range of Dl for eight independent experiments using the pairwise t-test. Sample sizes for the experiments are as follows n1=72, n2=76, n3=50, n4=72, n5=78, n6=74, n7=74, n8=80. (C) 95% confidence interval estimated by each independent experiment. Stars represent the estimated range of Dl for all experiments using pairwise t-test.
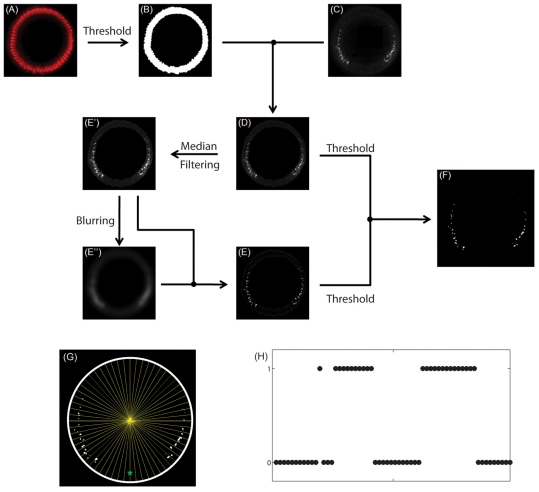
Quantification of sog expression. (A) Nuclear staining using DAPI. (B) Nuclear layer close to the embryo surface, obtained by applying a cutoff threshold for intensity in A. (C) Fluorescent in situ hybridization staining for sog intronic probe. (D) sog signal within the nuclear layer. (E) Non-linear filtering of the image in D. E′ is obtained from D using median filtering. E″ is obtained from E′ using Gaussian blurring. (F) Identified sog probes in the embryo, obtained by applying cutoff thresholds for the images in D and E simultaneously. (G) Binning the expression of sog intronic probes along the DV axis. (H) Binary vector resulting from image processing of data from a single embryo.
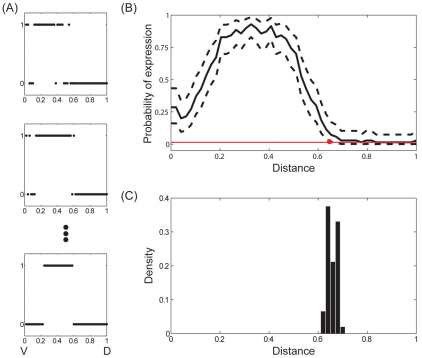
Spatial range of sog expression. (A) Examples of sog expression profiles in different embryos (n=68). (B) Mean sog expression profile during nuclear cycle 14 of embryogenesis. 0/1 corresponds to the ventral/dorsal sides of the embryo, respectively. Dashed curves indicate the 99% Bayesian confidence interval for probability of transcription at each point. From x=0 to x=0.66, the 99%CI for probability of transcription does not include the expected value of P(i) when there are no instances of expression. Therefore, we estimate the range of sog expression to be 0.66. (C) Probability distribution for the estimated range of sog expression.
References
-
- Affolter M., Basler K. (2007). The Decapentaplegic morphogen gradient: from pattern formation to growth regulation. Nat. Rev. Genet. 8, 663–674 - PubMed
-
- Ashe H. L., Briscoe J. (2006). The interpretation of morphogen gradients. Development 133, 385–394 - PubMed
-
- Bretzner L., Lindeberg T. (1998). Feature tracking with automatic selection of spatial scales. Computer Vision Image Understanding 71, 385–392
-
- Chopra V. S., Levine M. (2009). Combinatorial patterning mechanisms in the Drosophila embryo. Brief Funct. Genomic. Proteomic. 8, 243–249 - PubMed
Publication types
MeSH terms
Substances
Grants and funding
LinkOut - more resources
Full Text Sources
Molecular Biology Databases
