. 2011 Aug 23:5:43.
doi: 10.3389/fnint.2011.00043. eCollection 2011.

Dynamics of Circadian Thalamocortical Flow of Information during a Peripheral Neuropathic Pain Condition

Affiliations

Dynamics of Circadian Thalamocortical Flow of Information during a Peripheral Neuropathic Pain Condition

Helder Cardoso-Cruz et al. Front Integr Neurosci. .

Abstract

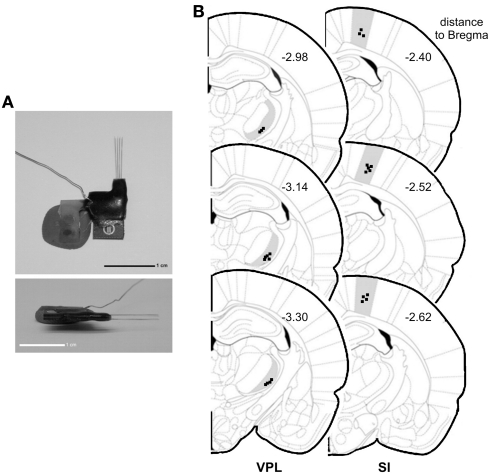
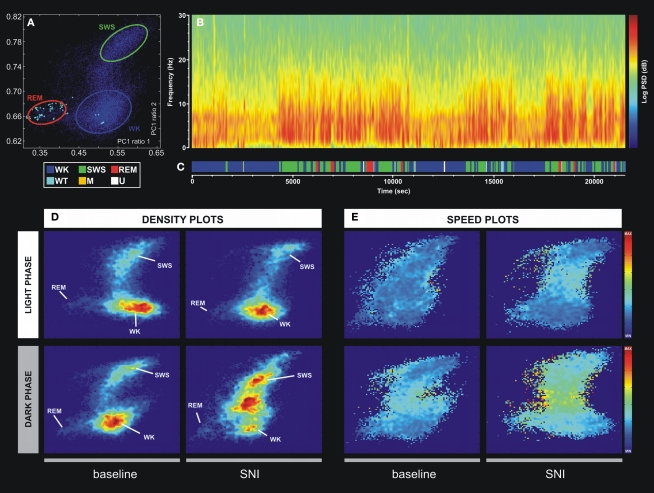
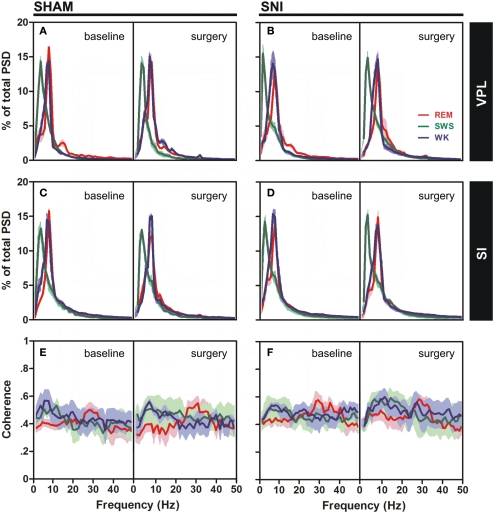
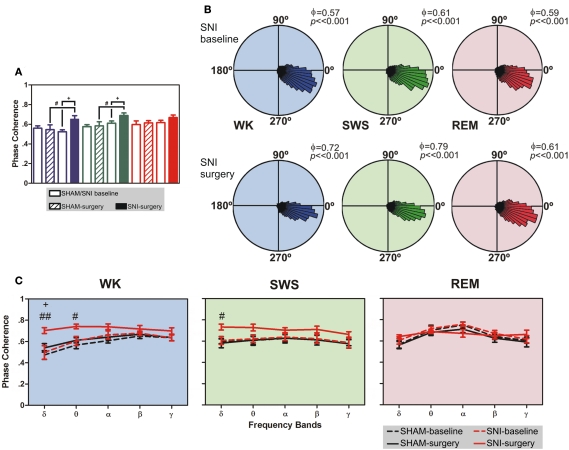
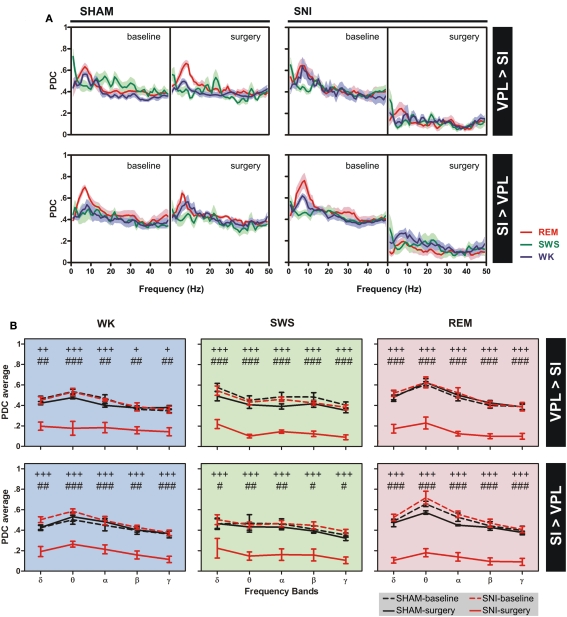
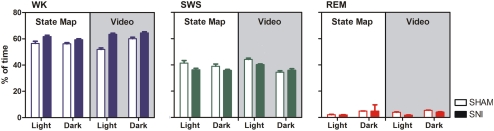
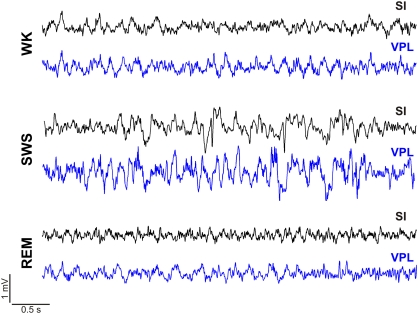
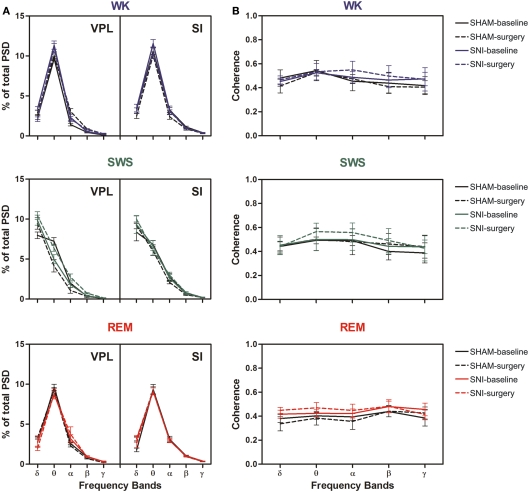
It is known that the thalamocortical loop plays a crucial role in the encoding of sensory-discriminative features of painful stimuli. However, only a few studies have addressed the changes in thalamocortical dynamics that may occur after the onset of chronic pain. Our goal was to evaluate how the induction of chronic neuropathic pain affected the flow of information within the thalamocortical loop throughout the brain states of the sleep-wake cycle. To address this issue we recorded local field potentials (LFPs) - both before and after the establishment of neuropathic pain in awake freely moving adult rats chronically implanted with arrays of multielectrodes in the lateral thalamus and primary somatosensory cortex. Our results show that the neuropathic injury induced changes in the number of wake and slow-wave-sleep (SWS) state episodes, and especially in the total number of transitions between brain states. Moreover, partial directed coherence - analysis revealed that the amount of information flow between cortex and thalamus in neuropathic animals decreased significantly, indicating that the overall thalamic activity had less weight over the cortical activity. However, thalamocortical LFPs displayed higher phase-locking during awake and SWS episodes after the nerve lesion, suggesting faster transmission of relevant information along the thalamocortical loop. The observed changes are in agreement with the hypothesis of thalamic dysfunction after the onset of chronic pain, and may result from diminished inhibitory effect of the primary somatosensory cortex over the lateral thalamus.

Keywords: intracranial recordings; partial directed coherence; rat; spared nerve injury model; thalamocortical.


Figures

Figure 1
Figure 1
Electrode construction and location of recordings. (A) Architecture of a microelectrode array used to record local field potentials (LFPs). (B) Coronal diagram illustrating the location of the LFPs recording sites (dark squares) in ventro-posterior-lateral thalamic nuclei (VPL) (left side) and in primary somatosensory cortex (SI) (right side). Numbers represent the rostro-caudal distance (in millimeters) relative to bregma.
Figure 2
Figure 2
Example of the technique used for statistical classification of oscillatory patterns according to Principal Component Analysis of the LFP signals. (A) Two-dimension brain StateMap. Three major clusters were represented corresponding to waking state (WK), slow-wave-sleep (SWS) and rapid-eye-movement (REM) states. (B) Power spectrogram of a SI LFP channel showing the different patterns of signal power oscillations across brain state episodes transitions. (C) Brain states hypnogram obtained from two-dimensional state illustrated in panel A. Six different brain states were coded: WK, SWS, REM, whisker-twitching (WT), M (undefined movement), and U (transition states). (D) Density plots calculated from scatter plots [e.g., (A)], showing the conserved cluster topography and the relative abundance of the various brain states. Scale from dark-blue (low-density) to red (high-density). (E) Speed plots representing the average of spontaneous trajectories within the two-dimensional StateMap. Stationarity (low speed) can be observed in the three main clusters (WK, SWS, and REM), whereas a maximum speed is reached during transitions from one clusters to another. After SNI lesion the velocity between WK and SWS state episodes increased, suggesting also an increase of WK/SWS transitions during the neuropathic pain period.
Figure 3
Figure 3
Spectral analysis of SI–VPL LFPs channels during WK (blue), SWS (green), and REM (red) states. Data were presented comparing the baseline (left side of each panel) and respective SHAM or SNI lesion (right side). Values are expressed for all animals as mean (±SEM). (A–D) Power spectral density (PSD) of LFPs normalized by the percentage of total power within the frequency range analyzed (1–50 Hz) for VPL (A,B) and SI (C,D) channels. PSD showed that spectral power patterns were conserved across the experimental groups. (E,F) Coherence between VPL and SI LFPs showed similar levels of coherence activity across all experimental groups.
Figure 4
Figure 4
Phase-locking of cortical and thalamic local field potentials. (A) Comparison of mean phase–coherence of SI–VPL LFPs segments recorded during WK, SWS, and REM states. Data was calculated for a 1- to 50-Hz frequency range. A significant increase of phase–coherence was observed for WK and SWS episodes after nerve lesion. (B) Examples of LFPs phase distributions during WK, SWS, and REM episodes for one rat submitted to the nerve lesion protocol. The numbers in the upper right corner of each plot shows the value of the mean phase–coherence. All circular-concentration distributions are significantly non-uniform (Rayleigh test, P < 0.01) indicating a high degree of thalamocortical phase synchronization. (C) Average phase–coherence across frequency bands analyzed during the baseline and respective SHAM or SNI lesion (surgery). Frequency bands: delta (δ, 1–4 Hz), theta (θ, 4–9 Hz), alpha (α, 9–15 Hz), beta (β, 15–30 Hz), and slow-gamma (γ, 30–50 Hz). Comparison of SNI-surgery in respect to SNI-baseline (plus symbols), and to SHAM-surgery (cardinal symbols). Values are expressed as mean ± SEM. +/# P < 0.0125, ++/## P < 0.0025, +++/### P < 0.0002 (Bonferroni test with corrected P-value).
Figure 5
Figure 5
Information flow between the two recorded regions were determined by partial directed coherence (PDC) analysis during WK (blue), SWS (green), and REM (red) states. (A) The amount of information flow in ascending (VPL-to-SI) and descending (SI-to-VPL) directions did not show significant differences for SHAM-lesion animals, while decreased significantly for SNI group after peripheral nerve lesion, indicating that less information was processed in the thalamocortical circuit after lesion. (B) The averaged PDC across frequency bands revealed a significant decrease of information flow for both directions at all frequency bands. Frequency bands: delta (δ, 1–4 Hz), theta (θ, 4–9 Hz), alpha (α, 9–15 Hz), beta (β, 15–30 Hz), and slow-gamma (γ, 30–50 Hz). Comparison of SNI-surgery groups in respect to SNI-baseline (plus symbols), and to SHAM-surgery (cardinal symbols). Values are expressed as mean ± SEM. +/# P < 0.0125, ++/## P < 0.0025, +++/### P < 0.0002 (Bonferroni test with corrected P-value).
Figure A1
Figure A1
Comparison of the efficiency in states detection between the StateMap algorithm selection vs. visual inspection of the video recordings and spectral bands. Brain states are expressed as percentage of the total recording time during the light and dark phases in the SNI group (filled bars) and in the SHAM-group plotted for waking state (WK, blue), slow-wave-sleep (SWS, green), and rapid-eye-movement (REM, red). No statistical differences were encountered between both methodologies of detection (Mann–Whitney test, P < 0.05). The determinations are expressed for all animals as mean (±SEM).
Figure A2
Figure A2
Oscillations on intracranial local field potentials (LFPs) recorded in one session during the dark phase (SHAM-baseline period) simultaneously in the primary somatosensory cortex (SI, black trace) and in the ventro-posterior-lateral thalamic nuclei (VPL, blue trace). Raw recordings representing 5-s of ongoing LFP activity recorded during a waking state (WK) episode, slow-wave-sleep (SWS), and rapid-eye-movement (REM) states.
Figure A3
Figure A3
Spectral analysis of SI–VPL LFPs channels during WK (blue), SWS (green), and REM (red) state episodes across frequency bands. Frequency bands: delta (δ, 1–4 Hz), theta (θ, 4–9 Hz), alpha (α, 9–15 Hz), beta (β, 15–30 Hz), and slow-gamma (γ, 30–50 Hz). Each point represents the mean value within the frequency band. Experimental groups were represented: SHAM-baseline (continuous black line), SHAM-surgery (black line-dotted), SNI-baseline (continuous color line: WK (blue), SWS (green), and REM (red), and SNI-surgery (color line-dotted). (A) Left column represents the power spectra density (PSD) measurements across frequency bands for the two recorded areas (ventro-posterior-lateral thalamic nuclei, VPL and primary somatosensory cortex – SI). Analysis of variance revealed no differences across experimental groups [(SHAM-baseline/SHAM-surgery) – VPL: WK F(1,25) = 1.61, P = 0.1874, SWS F(1,25) = 0.27, P = 0.6081, REM F(1,25) = 0.41, P = 0.5271; and SI: WK F(1,25) = 3.71, P = 0.0538, SWS F(1,25) = 3.04, P = 0.0934, REM F(1,25) = 1.34, P = 0.2588; (SHAM-baseline/SNI-baseline) – VPL: WK F(1,50) = 2.24, P = 0.0989, SWS F(1,50) = 0.10, P = 0.7552, REM F(1,50) = 0.02, P = 0.8800; and SI: WK F(1,50) = 0.46, P = 0.4993, SWS F(1,50) = 0.19, P = 0.6683, REM F(1,50) = 0.76, P = 0.3900; (SNI-baseline/SNI-surgery) – VPL: WK F(1,25) = 1.86, P = 0.4147, SWS F(1,25) = 0.25, P = 0.6237, REM F(1,25) = 0.08, P = 0.7753; and SI: WK F(1,25) = 1.53, P = 0.2281, SWS F(1,25) = 1.72, P = 0.4266, REM F(1,25) = 0.21, P = 0.6500; (SHAM-surgery/SNI-surgery) – VPL: WK F(1,50) = 0.76, P = 0.3880, SWS F(1,50) = 3.43, P = 0.0698, REM F(1,50) = 0.01, P = 0.9999; and SI: WK F(1,50) = 3.35, P = 0.0732, SWS F(1,50) = 1.58, P = 0.6673, REM F(1,50) = 0.40, P = 0.5288] and interaction [(SHAM-baseline/SHAM-surgery) – VPL: WK F(4,25) = 2.74, P = 0.0510, SWS F(4,25) = 0.75, P = 0.5652, REM F(4,25) = 1.29, P = 0.3009; and SI: WK F(4,25) = 0.69, P = 0.6073, SWS F(4,25) = 074, P = 0.5693, REM F(4,25) = 2.42, P = 0.0750; (SHAM-baseline/SNI-baseline) – VPL: WK F(4,50) = 2.66, P = 0.0701, SWS F(4,50) = 0.33, P = 0.8566, REM F(4,50) = 1.04, P = 0.3979; and SI: WK F(4,50) = 0.80, P = 0.5339, SWS F(4,50) = 0.88, P = 0.5407, REM F(4,50) = 2.44, P = 0.0590; (SNI-baseline/SNI-surgery) – VPL: WK F(4,25) = 1.93, P = 0.3969, SWS F(4,25) = 0.60, P = 0.6686, REM F(4,25) = 1.15, P = 0.3561; and SI: WK F(4,25) = 0.81, P = 0.5322, SWS F(4,25) = 1.97, P = 0.1294, REM F(4,25) = 0.34, P = 0.8449; (SHAM-surgery/SNI-surgery) – VPL: WK F(4,50) = 2.23, P = 0.1003, SWS F(4,50) = 0.69, P = 0.5992, REM F(4,50) = 1.45, P = 0.2703; and SI: WK F(4,50) = 0.45, P = 0.7730, SWS F(4,50) = 2.20, P = 0.0823, REM F(4,50) = 0.26, P = 0.9030], and as expected an effect across frequency bands [(SHAM-baseline/SHAM-surgery) – VPL: WK F(4,25) = 459.20, P < 0.0001, SWS F(4,25) = 185.40, P < 0.0001, REM F(4,25) = 381.80, P < 0.0001; and SI: WK F(4,25) = 337.10, P < 0.0001, SWS F(4,25) = 239.10, P < 0.0001, REM F(4,25) = 293.80, P < 0.0001; (SHAM-baseline/SNI-baseline) – VPL: WK F(4,50) = 542.90, P < 0.0001, SWS F(4,50) = 83.05, P < 0.0001, REM F(4,50) = 183.30, P < 0.0001; and SI: WK F(4,50) = 274.40, P < 0.0001, SWS F(4,50) = 244.50, P < 0.0001, REM F(4,50) = 255.60, P < 0.0001; (SNI-baseline/SNI-surgery) – VPL: WK F(4,25) = 272.80, P < 0.0001, SWS F(4,25) = 91.82, P < 0.0001, REM F(4,25) = 67.83, P < 0.0001; and SI: WK F(4,25) = 270.40, P < 0.0001, SWS F(4,25) = 172.50, P < 0.0001, REM F(4,25) = 165.10, P < 0.0001; (SHAM-surgery/SNI-surgery) – VPL: WK F(4,50) = 358.20, P < 0.0001, SWS F(4,50) = 246.40, P < 0.0001, REM F(4,50) = 163.10, P < 0.0001; and SI: WK F(4,50) = 296.80, P < 0.0001, SWS F(4,50) = 189.80, P < 0.0001, REM F(4,50) = 244.40, P < 0.0001]. (B) Right column represents the thalamocortical VPL–SI coherence activity. Analysis of variance revealed no significant differences across experimental groups [(SHAM-baseline/SHAM-surgery): WK F(1,25) = 0.21, P = 0.6524, SWS F(1,25) = 0.25, P = 0.6202, REM F(1,25) = 0.12, P = 0.7314; (SHAM-baseline/SNI-baseline): WK F(1,50) = 0.11, P = 0.7419, SWS F(1,50) = 0.31, P = 0.5815, REM F(1,50) = 2.26, P = 0.1388; (SNI-baseline/SNI-surgery): WK F(1,25) = 0.62, P = 0.4378, SWS F(1,25) = 0.50, P = 0.4882, REM F(1,25) = 0.20, P = 0.6553; (SHAM-surgery/SNI-surgery): WK F(1,50) = 2.11, P = 0.1530, SWS F(1,50) = 0.27, P = 0.6026, REM F(1,50) = 3.87, P = 0.0544], frequency bands [(SHAM-baseline/SHAM-surgery): WK F(4,25) = 1,64, P = 0.1956, SWS F(4,25) = 0.43, P = 0.7844, REM F(4,25) = 0.90, P = 0.4783; (SHAM-baseline/SNI-baseline): WK F(4,50) = 0.58, P = 0.6721, SWS F(4,50) = 0.66, P = 0.6208, REM F(4,50) = 0.63, P = 0.6431; (SNI-baseline/SNI-surgery): WK F(4,25) = 0.32, P = 0.8626, SWS F(4,25) = 0.51, P = 0.7284, REM F(4,25) = 0.46, P = 0.7675; (SHAM-surgery/SNI-surgery): WK F(4,50) = 0.97, P = 0.4346, SWS F(4,50) = 0.51, P = 0.7293, REM F(4,50) = 0.55, P = 0.7006], and interaction effect [groups × frequency bands; (SHAM-baseline/SHAM-surgery): WK F(4,25) = 0.09, P = 0.9851, SWS F(4,25) = 0.08, P = 0.9879, REM F(4,25) = 0.21, P = 0.9295; (SHAM-baseline/SNI-baseline): WK F(4,50) = 0.15, P = 0.9613, SWS F(4,50) = 0.05, P = 0.9956, REM F(4,50) = 0.11, P = 0.9784; (SNI-baseline/SNI-surgery): WK F(4,25) = 0.16, P = 0.9560, SWS F(4,25) = 0.17, P = 0.9508, REM F(4,25) = 0.32, P = 0.8607; (SHAM-surgery/SNI-surgery): WK F(4,50) = 0.13, P = 0.9718, SWS F(4,50) = 0.11, P = 0.9779, REM F(4,50) = 0.48, P = 0.7508]. The determinations are expressed for all animals as mean (±SEM).

Similar articles

Cited by

References

    1. Achermann P., Borbely A. A. (1997). Low-frequency (<1 Hz) oscillations in the human sleep electroencephalogram. Neuroscience 81, 213–22210.1016/S0306-4522(97)00186-3 - DOI - PubMed
    1. Andersen M. L., Tufik S. (2003). Sleep patterns over 21-day period in rats with chronic constriction of sciatic nerve. Brain Res. 984, 84–9210.1016/S0006-8993(03)03095-6 - DOI - PubMed
    1. Apkarian A. V., Sosa Y., Sonty S., Levy R. M., Harden R. N., Parrish T. B., Gitelman D. R. (2004). Chronic back pain is associated with decreased prefrontal and thalamic gray matter density. J. Neurosci. 24, 10410–1041510.1523/JNEUROSCI.2541-04.2004 - DOI - PMC - PubMed
    1. Baccala L. A., Sameshima K. (2001). Partial directed coherence: a new concept in neural structure determination. Biol. Cybern. 84, 463–47410.1007/PL00007990 - DOI - PubMed
    1. Baliki M. N., Geha P. Y., Apkarian A. V., Chialvo D. R. (2008). Beyond feeling: chronic pain hurts the brain, disrupting the default-mode network dynamics. J. Neurosci. 28, 1398–140310.1523/JNEUROSCI.4123-07.2008 - DOI - PMC - PubMed

LinkOut - more resources