. 2011 Nov 17;3(4):e00068.
doi: 10.1042/AN20110027.

Early effects of lipopolysaccharide-induced inflammation on foetal brain development in rat

Affiliations

Early effects of lipopolysaccharide-induced inflammation on foetal brain development in rat

Cristina A Ghiani et al. ASN Neuro. .

Abstract

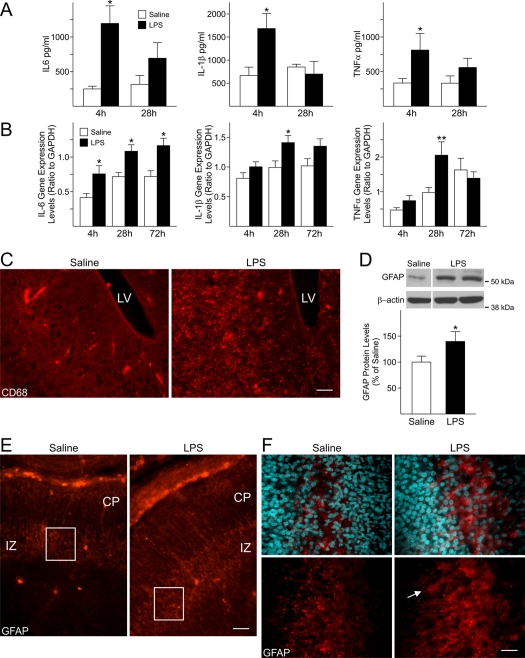
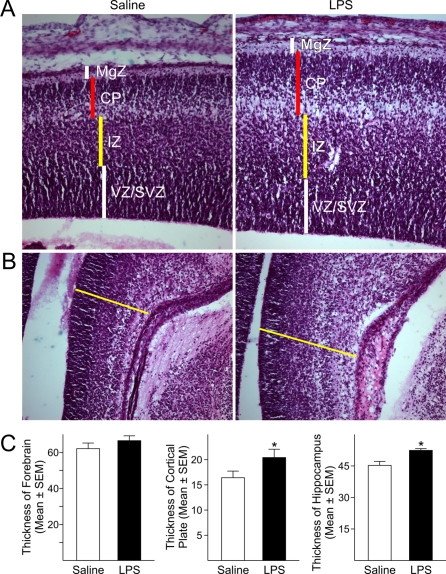
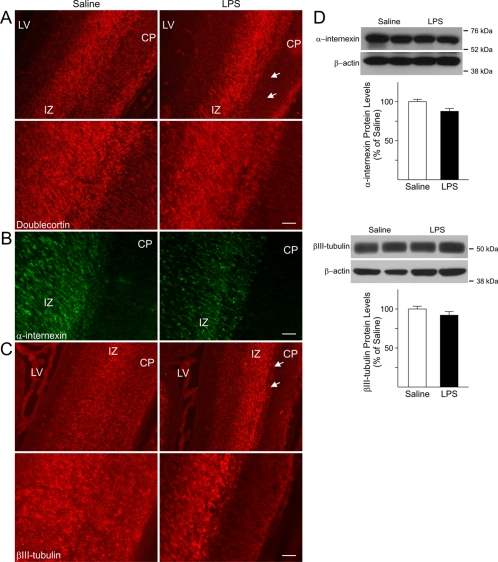
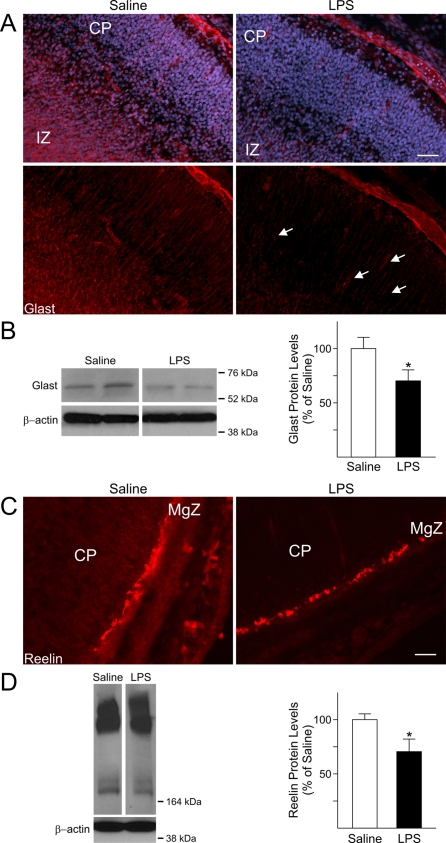
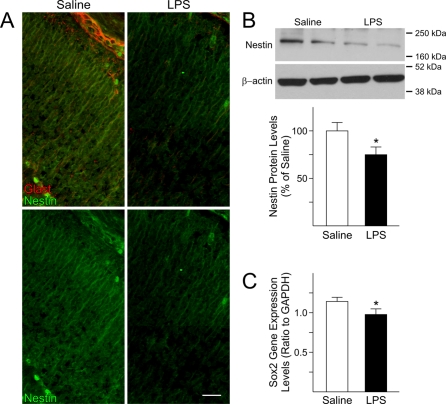
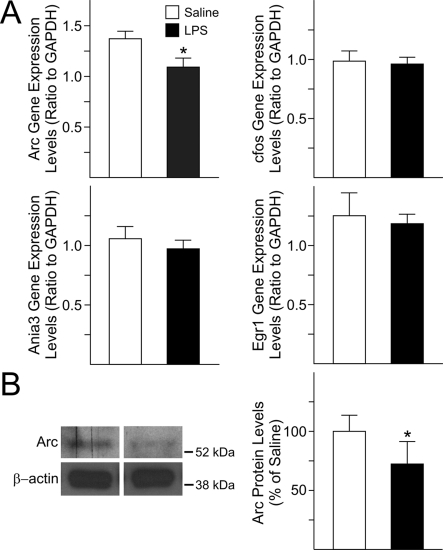
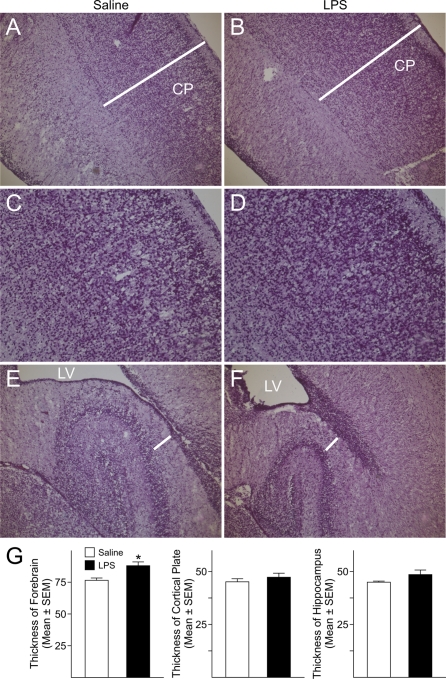
Studies in humans and animal models link maternal infection and imbalanced levels of inflammatory mediators in the foetal brain to the aetiology of neuropsychiatric disorders. In a number of animal models, it was shown that exposure to viral or bacterial agents during a period that corresponds to the second trimester in human gestation triggers brain and behavioural abnormalities in the offspring. However, little is known about the early cellular and molecular events elicited by inflammation in the foetal brain shortly after maternal infection has occurred. In this study, maternal infection was mimicked by two consecutive intraperitoneal injections of 200 μg of LPS (lipopolysaccharide)/kg to timed-pregnant rats at GD15 (gestational day 15) and GD16. Increased thickness of the CP (cortical plate) and hippocampus together with abnormal distribution of immature neuronal markers and decreased expression of markers for neural progenitors were observed in the LPS-exposed foetal forebrains at GD18. Such effects were accompanied by decreased levels of reelin and the radial glial marker GLAST (glial glutamate transporter), and elevated levels of pro-inflammatory cytokines in maternal serum and foetal forebrains. Foetal inflammation elicited by maternal injections of LPS has discrete detrimental effects on brain development. The early biochemical and morphological changes described in this work begin to explain the sequelae of early events that underlie the neurobehavioural deficits reported in humans and animals exposed to prenatal insults.


Figures

Figure 1
Figure 1. Maternal injections of LPS elicited an inflammatory response in the foetal forebrain
(A) Cytokine levels were significantly increased in maternal serum 4 h after the first injection of LPS (200 μg/kg, intraperitoneally) Dams were injected at GD15 and GD16 and killed 4 h after the first (4 h) or the second LPS-injection (28 h). Results were plotted as the means±S.E.M. for five or six saline-injected dams and nine or ten LPS-injected dams per time point. *P<0.05 versus respective control (saline-injected dams), One-way ANOVA followed by Bonferroni's multiple comparison test. (B) Pro-inflammatory cytokine expression levels were increased in the foetal forebrain at different time-points after maternal injections of LPS. Cytokine expression levels were measured in the foetal cerebral cortex by qRT–PCR at GD15, 4 h after the first (4 h) maternal injection of LPS or saline; at GD16, 4 h after the second injection (28 h), and at GD18, 48 h after the second maternal injection of LPS or saline (72 h). At least three foetuses/dam/group/time-point were analysed. Levels were normalized to GAPDH. Histograms represent the means±S.E.M. of 9–30 foetuses from five or six saline-injected dams and eight to ten LPS-injected dams per time point. *P<0.05, **P<0.01 versus respective saline-exposed foetuses, One-way ANOVA followed by Bonferroni's multiple comparison test. (CF) Dams received two consecutive injections of LPS (200 μg/kg, intraperitoneally) at GD15 and GD16 and were killed at GD18. (C) The microglial marker CD68 was strongly expressed in the LPS-exposed foetal forebrain at GD18. LV, lateral ventricle. Scale bar = 50 μm. (D) A significant increase in GFAP protein levels was found at GD18 in LPS-exposed foetal cerebral cortex. Values derived from the densitometric analysis were corrected for the background, normalized to β-actin and are shown as a percentage of the value for saline-exposed foetuses. The histogram shows represents the means±S.E.M. for 11–12 foetuses from seven saline-injected and seven LPS-injected dams. *P<0.05 versus saline-exposed foetuses, Student's t test. (E) GFAP immunoreactivity was mainly localized in the IZ in both LPS- and saline-exposed foetuses. Scale bar = 50 μm. (F) Higher magnification of the insets in (B) shows that GFAP-positive cells display a reactive phenotype in the IZ of LPS-exposed foetuses (arrow). Nuclei were identified by DAPI staining. Scale bar = 20 μm.
Figure 2
Figure 2. Maternal injections of LPS hindered the development of brain structures
(A) H&E staining of GD18 foetal forebrain showed a significant enlargement of the CP in the forming cerebral cortex of LPS-exposed foetuses compared with saline-exposed foetuses. No significant differences were found in the thickness of other laminae of the cerebral cortex or in the total thickness of the cortex. (B) The hippocampus of LPS-exposed foetuses was significantly larger than in control animals. (C) Quantifications of the differences in the thickness of the forebrain, CP and hippocampus. Histograms represent the means±S.E.M. for six rat foetuses from six saline-injected and six LPS-injected dams. *P<0.05 versus saline-exposed foetuses, Student's t test. MgZ, marginal zone; IZ, intermediate zone; VZ/SVZ, ventricular zone/subventricular zone.
Figure 3
Figure 3. Abnormal distribution of markers for immature neurons in the foetal forebrain after maternal injections of LPS
(A) Doublecortin immunoreactivity was seen in both the CP and IZ in GD18 foetuses from saline-injected dams. Conversely, doublecortin-positive cells were mostly detected in the IZ of age-matched foetuses exposed to LPS, while the CP displayed lower immunoreactivity. Lower panels are higher magnifications of the area marked by the two arrows showing the atypical distribution of doublecortin positive cells in the CP and IZ of LPS-exposed animals. (B) Expression of the immature neuronal marker α-internexin could be seen in the IZ of GD18 LPS-exposed foetuses and was almost absent in the CP as compared with age-matched control (Saline). (C) Expression of βIII-tubulin could be observed throughout the cerebral cortex in GD18 saline-exposed foetuses. In the cerebral cortex of LPS-exposed foetuses, immunoreactivity for this marker was mainly found in the IZ, while it was almost absent in the CP. Lower panels are higher magnifications of the area marked by the two arrows. Scale bar = 50 μm. LV, lateral ventricle. (D) No differences were found in the protein levels of α-internexin and βIII-tubulin measured in whole tissue lysates prepared from cerebral cortices of GD18 saline- and LPS-exposed foetuses. Values derived from the densitometric analysis were corrected for the background, normalized to β-actin and are shown as a percentage of the value for saline-exposed animals. Histograms are the means±S.E.M. for 17 foetuses from seven dams injected with saline and 18 foetuses from eight LPS-injected dams.
Figure 4
Figure 4. Altered expression levels of GLAST and Reelin in the foetal forebrain after maternal immune system activation with LPS
(A) Processes immunopositive for GLAST were observed throughout the IZ and the CP of GD18 saline-exposed foetuses, whereas they were evidently decreased in the corresponding areas of GD18 LPS-exposed animals. Nuclei were identified by DAPI staining. (B) The total protein levels of GLAST were significantly decreased in the cerebral cortex of GD18 LPS-exposed foetuses compared with control. Values derived from the densitometric analysis were corrected for the background, normalized to β-actin, and are shown as a percentage of the value for saline-exposed animals. Histograms are the means±S.E.M. for 12 foetuses from seven dams injected with saline and 15 foetuses from eight LPS-injected dams. *P<0.05 versus saline-exposed foetuses, Student's t test. (C) Immunoreactivity of the glycoprotein protein reelin was decreased in the Cajal-Retzius cells in the MgZ of forebrains from GD18 LPS-exposed foetuses compared with saline. Scale bars = 50 μm. (D) Representative immunoblots showing that the protein levels of the 180 kDa isoform of reelin were significantly decreased in whole tissue lysates from the cerebral cortex of GD18 LPS-exposed foetuses. Values are shown as a percentage of the value for saline-exposed animals. Histograms are the means±S.E.M. for five foetuses from three dams injected with saline and five foetuses from three LPS-injected dams. *P<0.05 versus saline-exposed foetuses, Student's t test.
Figure 5
Figure 5. Expression of neural progenitor cells markers in the foetal forebrain is disturbed after maternal injections of LPS
(A) Immunoreactivity for nestin, a marker for neural progenitors, was decreased at GD18 in the foetal cerebral cortex of LPS-exposed foetuses compared with foetuses from saline-injected dams. Upper panels: double immunostaining for nestin in green and GLAST in red; lower panels: single immunostaining for nestin. Scale bar = 50 μm. (B) Representative immunoblots showing that nestin protein levels were significantly decreased in whole tissue lysates from the cerebral cortex of GD18 LPS-exposed foetuses. Values derived from densitometric analysis were corrected for the background, normalized to β-actin, and are shown as a percentage of the value for saline-exposed animals. Histograms are the means±S.E.M. for ten foetuses from five dams injected with saline and ten foetuses from five LPS-injected dams. *P<0.05 versus saline-exposed foetuses, Student's t test. (C) The gene expression levels of the transcription factor Sox2 were decreased in the foetal cerebral cortex after maternal injections of LPS. Sox2 expression was measured by qRT–PCR in the cerebral cortex of GD18 foetuses from saline and LPS-injected dams. The levels were normalized to GAPDH. Histograms represent the means±S.E.M. for 15 foetuses from seven saline-injected dams and 15 foetuses from seven LPS-injected dams. *P<0.05 versus saline-exposed foetuses, Student's t test.
Figure 6
Figure 6. Gene and protein expression levels of IEG in the foetal forebrain following maternal immune system activation with LPS
(A) Only the gene expression levels of Arc were significantly decreased in the cerebral cortex of GD18 foetuses from LPS-treated dams compared with control. Changes in gene expression levels of Arc, cfos, Ania-3 and Egr-1 were measured by qRT–PCR in the cerebral cortex of foetuses from saline and LPS-injected dams. The levels were normalized to GAPDH. Histograms represent the means±S.E.M. for 16 foetuses from five saline-injected dams and 14 from five LPS-injected dams. *P<0.05 versus saline-exposed foetuses, Student's t test. (B) The total protein levels of Arc were decreased in whole tissue lysates from GD18 foetal cerebral cortex after maternal injections of LPS. Values derived from densitometric analysis were corrected for the background, normalized to β-actin, and are shown as a percentage of the value for saline-exposed animals. Histograms are the means±S.E.M. for ten foetuses from five dams injected with saline and 11 from five LPS-injected dams. *P<0.05 versus saline-exposed foetuses, Student's t test.
Figure 7
Figure 7. Changes in the offspring forebrain after prenatal foetal and maternal immune activation with LPS
Dams received two consecutive injections of LPS (200 μg/kg, intraperitoneally) at GD15 and GD16 and the offspring were killed at postnatal day (P)1. (A, B) H&E staining revealed lack of significant differences in the thickness of the CP in P1 rats born to dams injected with saline or LPS; conversely, a significant enlargement of the cerebral cortex was found in P1 rats born to LPS-injected dams. (C, D) Higher magnification images showing increased cell density in the CP of P1 rats prenatally exposed to the effects of maternal injections of LPS. (E, F) No significant differences were found in the thickness of the hippocampus measured at the transition between the CA1 and CA2 areas. White bars indicate where the measurements were performed. LV, lateral ventricle. (G) Quantifications of the differences in the thickness of the cerebral cortex, CP and hippocampus. Histograms represent the means±S.E.M. for three P1 control (saline) and three P1 rats prenatally exposed to LPS. *P<0.05 versus saline-exposed P1 rats, Student's t test.

References

    1. Ashdown H, Dumont Y, Ng M, Poole S, Boksa P, Luheshi GN. The role of cytokines in mediating effects of prenatal infection on the fetus: implications for schizophrenia. Mol Psychiatry. 2006;11:47–55. - PubMed
    1. Bayer SA, Altman J. Neocortical Development: Raven Press. 1991
    1. Bell MJ, Hallenbeck JM. Effects of intrauterine inflammation on developing rat brain. J Neurosci Res. 2002;70:570–579. - PubMed
    1. Bell MJ, Hallenbeck JM, Gallo V. Determining the fetal inflammatory response in an experimental model of intrauterine inflammation in rats. Pediatr Res. 2004;56:541–546. - PubMed
    1. Berger-Sweeney J, Hohmann CF. Behavioral consequences of abnormal cortical development: insights into developmental disabilities. Behav Brain Res. 1997;86:121–142. - PubMed

Publication types

MeSH terms