. 2011 Oct 18:12:514.
doi: 10.1186/1471-2164-12-514.

Functional annotation of the transcriptome of Sorghum bicolor in response to osmotic stress and abscisic acid

Affiliations

Functional annotation of the transcriptome of Sorghum bicolor in response to osmotic stress and abscisic acid

Diana V Dugas et al. BMC Genomics. .

Abstract

Background: Higher plants exhibit remarkable phenotypic plasticity allowing them to adapt to an extensive range of environmental conditions. Sorghum is a cereal crop that exhibits exceptional tolerance to adverse conditions, in particular, water-limiting environments. This study utilized next generation sequencing (NGS) technology to examine the transcriptome of sorghum plants challenged with osmotic stress and exogenous abscisic acid (ABA) in order to elucidate genes and gene networks that contribute to sorghum's tolerance to water-limiting environments with a long-term aim of developing strategies to improve plant productivity under drought.

Results: RNA-Seq results revealed transcriptional activity of 28,335 unique genes from sorghum root and shoot tissues subjected to polyethylene glycol (PEG)-induced osmotic stress or exogenous ABA. Differential gene expression analyses in response to osmotic stress and ABA revealed a strong interplay among various metabolic pathways including abscisic acid and 13-lipoxygenase, salicylic acid, jasmonic acid, and plant defense pathways. Transcription factor analysis indicated that groups of genes may be co-regulated by similar regulatory sequences to which the expressed transcription factors bind. We successfully exploited the data presented here in conjunction with published transcriptome analyses for rice, maize, and Arabidopsis to discover more than 50 differentially expressed, drought-responsive gene orthologs for which no function had been previously ascribed.

Conclusions: The present study provides an initial assemblage of sorghum genes and gene networks regulated by osmotic stress and hormonal treatment. We are providing an RNA-Seq data set and an initial collection of transcription factors, which offer a preliminary look into the cascade of global gene expression patterns that arise in a drought tolerant crop subjected to abiotic stress. These resources will allow scientists to query gene expression and functional annotation in response to drought.


Figures

Figure 1
Figure 1
Experimental design and replication. The experiments were conducted three times (top three red-outlined boxes). For each experiment, three hydroponic buckets were treated with control (NaOH and H2O) or treatment (ABA and PEG) (middle grey box; colored diamond). After 27 hrs of treatment, 10 plants from each bucket were harvested, separated into roots and shoots, and RNA extracted (middle grey box; brown and green arrows). RNA samples from each bucket were combined in equimolar amounts and 5 μg of combined RNA used to create the Illumina RNA-Seq cDNA (bottom box; colored bins). Each flowcell (8 lanes) contained 4 root and 4 shoot samples, each having been treated with ABA, NaOH, PEG, or H2O for 27 hrs. The order of the samples on the flowcell was assigned by random draw for each Illumina run.
Figure 2
Figure 2
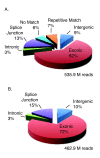
RNA-Seq analysis of the Sorghum bicolor transcriptome. Distribution of the total number of all sequencing reads that passed Illumina's filtering among annotated features across the sorghum genome (A). Distribution of the total number of all sequencing reads that passed Illumina's filtering and aligned uniquely to the sorghum genome (B).
Figure 3
Figure 3
Quantile Normalization of RNA-Seq Reads. Box-and-whisker plots show median reads per gene (black and red bars) and varying ranges (colored boxes) for the lanes before normalization (A), which are removed after normalization (B). Red bars denote the lanes analyzed using updated RTA V1.6 software and therefore display an increase in total read counts per lane. Whiskers denote the lowest datum still within 1.5 interquartile range (IQR) of the lower quartile, and the highest datum still within 1.5 IQR of the upper quartile. Scatterplots of counts/gene between runs 2 and 3 in ABA-treated roots before (C) and after quantile normalization (D). A = ABA-treatment; P = PEG-treatment; H = H2O control; N = NaOH control.
Figure 4
Figure 4
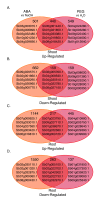
Overlap between differentially responsive genes following treatment with ABA and PEG. Venn diagrams display the overlap between differentially expressed genes following treatment with ABA (orange circles, right) and PEG (red circles, left) for 27 hrs in shoots (A, B) or roots (C, D). The total gene count for each category as well as the top five up- or down-regulated genes that exclusively fall into the given category are shown within each circle.
Figure 5
Figure 5
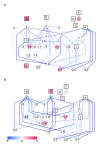
Networks of hormone pathways in ABA-treated plants. Networks were created considering the shortest paths connecting each hormone-related pathway to another hormone-related pathway in shoots (A) and roots (B). Hormone-related and non-hormone-related pathways are denoted as squares and circles, respectively, and are shaded based on the number of genes up-regulated within the pathway minus the number of genes down-regulated. Pathways that contain equal numbers of up- and down-regulated genes are white. Edges connecting the pathways occur only when differentially expressed genes are in common between the two pathways. Dark blue solid lines, blue long-dashed lines, and light blue short-dashed lines denote ≥10, 6-9, ≤5 DE genes, respectively, in common between the pathways. Pathway names are as follows: A, brassinosteroid biosynthesis; B, cytokinins degradation; C, cytokinins glucoside biosynthesis; D, ent-kaurene biosynthesis; E, ethylene biosynthesis from methionine; F, gibberellin biosynthesis; G, gibberellin inactivation; H, IAA conjugate biosynthesis; I, jasmonic acid biosynthesis; 1, anthocyanin biosynthesis; 2, ascorbate biosynthesis; 3, betanidin degradation; 4, Calvin cycle; 5, dTDP-L-rhamnose biosynthesis; 6, fructose degradation to pyruvate and lactate; 7, galactose degradation; 8, γ-glutamyl cycle; 9, gluconeogenesis; 10, glycolysis; 11, methionine biosynthesis; 12, oleoresin sesquiterpene volatiles biosynthesis; 13, oxidative ethanol degradation; 14, phenylalanine biosynthesis; 15, phenylpropanoid biosynthesis; 16, ribose degradation; 17, starch biosynthesis; 18, sucrose degradation; 19, sucrose degradation to ethanol and lactate; 20, threonine biosynthesis from homoserine; 21, triacylglycerol degradation; 22, UDP-galactose biosynthesis; 23, UDP-glucose conversion; 24, UDP-N-acetylgalactosamine biosynthesis.
Figure 6
Figure 6
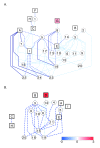
Networks of hormone pathways in PEG-treated plants. Networks were created considering the shortest paths connecting each hormone-related pathway to another hormone-related pathway in shoots (A) and roots (B). Hormone-related and non-hormone-related pathways are denoted as squares and circles, respectively, and are shaded based on the number of genes up-regulated within the pathway minus the number of genes down-regulated. Pathways that contain equal numbers of up- and down-regulated genes are white. Edges connecting the pathways occur only when differentially expressed genes are in common between the two pathways. Dark blue solid lines, blue long-dashed lines, and light blue short-dashed lines denote ≥10, 6-9, ≤5 DE genes, respectively, in common between the pathways. Pathway names (A-I and 1-24) are denoted as in Figure 5.
Figure 7
Figure 7
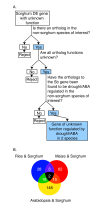
Determining the genes of unknown function that respond to drought or ABA treatment across species. Decision tree used to determine which genes and their orthologs were regulated by drought/ABA across different species (A). For each sorghum gene, the tree was traversed 3 times; once for each non-sorghum species: rice, maize, Arabidopsis. Venn diagram displaying the overlap of drought-responsive sorghum genes of unknown function that had drought-responsive orthologs of unknown function in other species (B). Each gene is found in 2 or more species.

References

    1. Boyer JS. Plant productivity and environment. Science. 1982;218(4571):443–448. - PubMed
    1. Gleick PH. Global freshwater resources: soft-path solutions for the 21st century. Science. 2003;302(5650):1524–1528. - PubMed
    1. Johnson N, Revenga C, Echeverria J. Ecology. Managing water for people and nature. Science. 2001;292(5519):1071–1072. - PubMed
    1. Amber D. Genetic responses to drought. Scientist. 2000. pp. 18–19.
    1. Bohnert HJ, Nelson DE, Jensen RG. Adaptations to environmental stresses. Plant Cell. 1995;7(7):1099–1111. - PMC - PubMed

Publication types