. 2012 Jan;15(1):24-33.
doi: 10.1111/j.1461-0248.2011.01703.x. Epub 2011 Oct 18.

Migratory flyway and geographical distance are barriers to the gene flow of influenza virus among North American birds

Affiliations

Migratory flyway and geographical distance are barriers to the gene flow of influenza virus among North American birds

Tommy Tsan-Yuk Lam et al. Ecol Lett. 2012 Jan.

Abstract

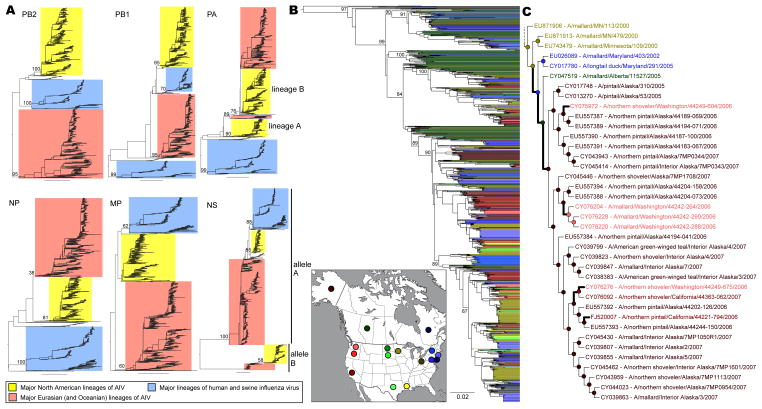
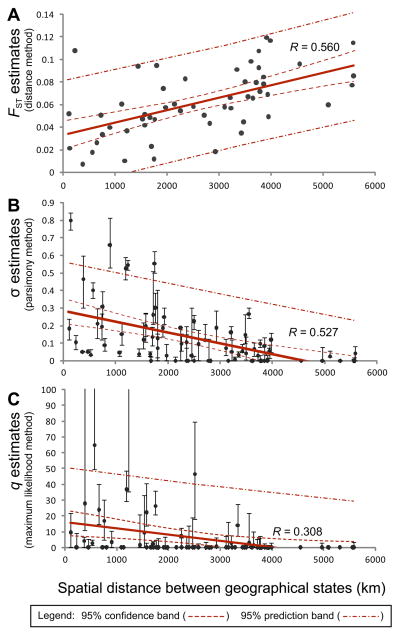
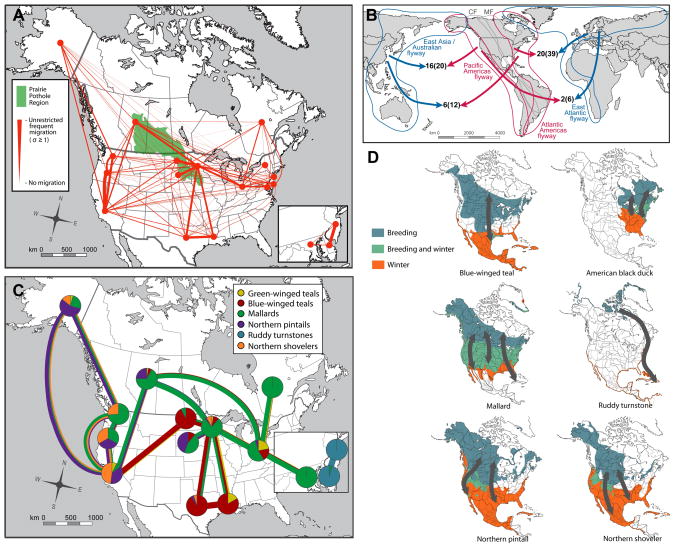
Despite the importance of migratory birds in the ecology and evolution of avian influenza virus (AIV), there is a lack of information on the patterns of AIV spread at the intra-continental scale. We applied a variety of statistical phylogeographic techniques to a plethora of viral genome sequence data to determine the strength, pattern and determinants of gene flow in AIV sampled from wild birds in North America. These analyses revealed a clear isolation-by-distance of AIV among sampling localities. In addition, we show that phylogeographic models incorporating information on the avian flyway of sampling proved a better fit to the observed sequence data than those specifying homogeneous or random rates of gene flow among localities. In sum, these data strongly suggest that the intra-continental spread of AIV by migratory birds is subject to major ecological barriers, including spatial distance and avian flyway.


Figures

Figure 1
Figure 1
Phylogenetic trees of the internal genome segments of influenza A virus. (A) ‘Panoramic’ phylogenies of the PB2, PB1, PA, NP, MP, and NS segments. Bootstrap support values are shown adjacent to selected nodes, and the scale bar represents 0.1 substitutions/site. Major North American lineages of AIV are highlighted in yellow. (B) Maximum likelihood phylogeny of the major North American wild bird AIV (NA-WB-AIV) lineage inferred from the PB2 gene. Terminal branches are extended and colored according to the place of sampling as shown in the inset map (14 US states and two Canadian provinces; others shown in grey). The scale bar is 0.02 substitutions/site. (C) A sub-lineage of NA-WB-AIV in the PB2 phylogeny, shown as a cladogram. Geographical states of the ancestral nodes (circles) were estimated, using parsimony, from taxon localities, and their colors are the same as those in panel A. Changes in geographical state that occurred during evolutionary history are indicated by bold branches.
Figure 2
Figure 2
The level of AIV gene flow between two geographical states plotted against their spatial distance. Estimates of viral gene flow (n=91) were inferred using three approaches: (A) FST (a distance method), (B) modified Slatkin-Maddison’s s (σ; a parsimony method), and (C) state transition rate (q; a maximum likelihood method). For illustration, we show the results from the NP gene data set only. The thick solid straight lines are linear regressions of gene flow rates and spatial distances (in units of km). 95% confidence and prediction ranges of regression are shown as dashed lines. Pearson’s coefficients (R) of the regressions are also shown. Error bars represent 95% confidence intervals of the estimates from 200 bootstrap phylogenies.
Figure 3
Figure 3
Flyway-specific rates of AIV gene flow. (A) Maximum likelihood estimates (q) of the average level of AIV internal gene flow (excluding the NS gene which has large confidence intervals) within and between the four flyways; Pacific flyway (PF; red), Central flyway (CF; green), Mississippi flyway (MF; yellow) and Atlantic flyway (AF; blue). The 4×4 rate matrices were projected onto the map. The color of the bar and the geographical region where the bar is located denote the flyway where gene flow is measured. For example, the red bar in the yellow terrestrial region represents the extent of gene flow between the PF and MF, while the red bar in the red terrestrial region represents the gene flow within PF. The rate of AIV gene flow within PF is shown next to the bar. Average 95% confidence intervals for the rate estimates are indicated by error bars. (B) The rate matrices (3×3) in a 3-flyway model in which CF and MF are merged.
Figure 4
Figure 4
Overall patterns of gene flow in AIV and the contribution of individual avian species. (A) Parsimony estimates (σ) of the average level of AIV gene flow in internal genes (n=120) between 14 US states and two Canada provinces (red circles). The thickness of the red lines represents the magnitude of σ estimates relative to panmixis (shown in the legend box). Gene flow between Maryland, New Jersey, and Delaware are shown in a zoom-in inset for clarity. (B) The putative number of inter-hemispheric AIV gene flow events during 1998–2008 (and 1927–2008, shown in parentheses) inferred from the panoramic phylogenies of the eight gene segments. (C) Species prevalence in the AIV data set (indicated by the pie-charts) and their contribution (indicated by the colored thick lines, in which the thickness denotes percentage) to AIV gene flow between selected localities where the extent of gene flow is above the 80th percentile of that seen in all localities. New York State was not displayed due to the small sample sizes of the duck species found in this region. (D) Distribution of bird species in North America during breeding and wintering periods. The approximate migration pathways observed in these bird species are shown by grey arrows. The illustrations were adapted from Birds of North America Online (http://bna.birds.cornell.edu).

References

    1. Bao Y, Bolotov P, Dernovoy D, Kiryutin B, Zaslavsky L, Tatusova T, Ostell J, Lipman D. The influenza virus resource at the National Center for Biotechnology Information. J Virol. 2008;82:596–601. - PMC - PubMed
    1. Causey D, Edwards SV. Ecology of avian influenza virus in birds. J Infect Dis. 2008;197:S29–33. - PMC - PubMed
    1. Chen H, Smith GJ, Zhang SY, Qin K, Wang J, Li KS, Webster RG, Peiris JS, Guan Y. Avian flu: H5N1 virus outbreak in migratory waterfowl. Nature. 2005;436:191–2. - PubMed
    1. Davidson NC, Rothwell PI, Pienkowski MW. Towards a flyway conservation strategy for waders. Wader Study Group Bull. 1995:70–81.
    1. Deibel R, Emord DE, Dukelow W, Hinshaw VS, Wood JM. Influenza viruses and paramyxoviruses in ducks in the Atlantic flyway, 1977–1983, including an H5N2 isolate related to the virulent chicken virus. Avian Dis. 1985;29:970–85. - PubMed

Publication types