

Population-based metrics for the timing of HIV diagnosis, engagement in HIV care, and virologic suppression
- PMID: 22008656
- PMCID: PMC3434867
- DOI: 10.1097/QAD.0b013e32834dcee9
Population-based metrics for the timing of HIV diagnosis, engagement in HIV care, and virologic suppression
Abstract
Objective: To compare population-based metrics for assessing progress toward the US National HIV/AIDS Strategy (NHAS) goals.
Design: Analysis of surveillance data from persons living with HIV/AIDS (PLWHA) in King County, Washington, USA, 2005-2009.
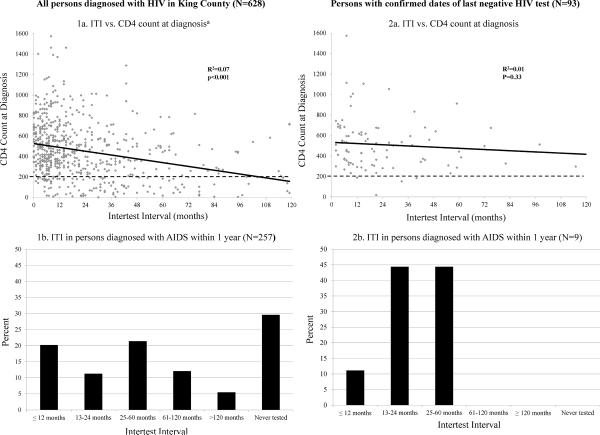
Methods: We examined indicators of the timing of HIV diagnosis [intertest interval, CD4 cell count at diagnosis, and AIDS ≤ 1 year of diagnosis (late diagnosis)]; linkage to initial care (CD4 or viral load report ≤3 months after diagnosis) and sustained care (a laboratory report 3-9 months after linkage); engagement in continuous care in 2009 (at least two laboratory reports ≥3 months apart); and virologic suppression.
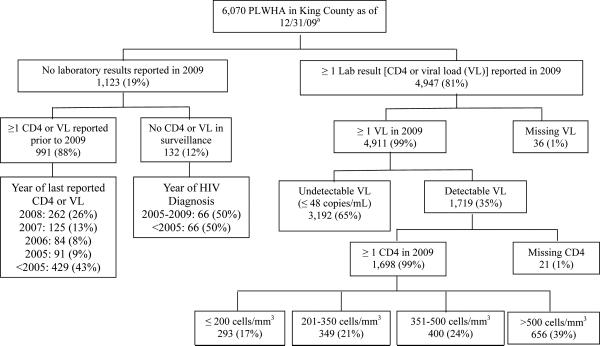
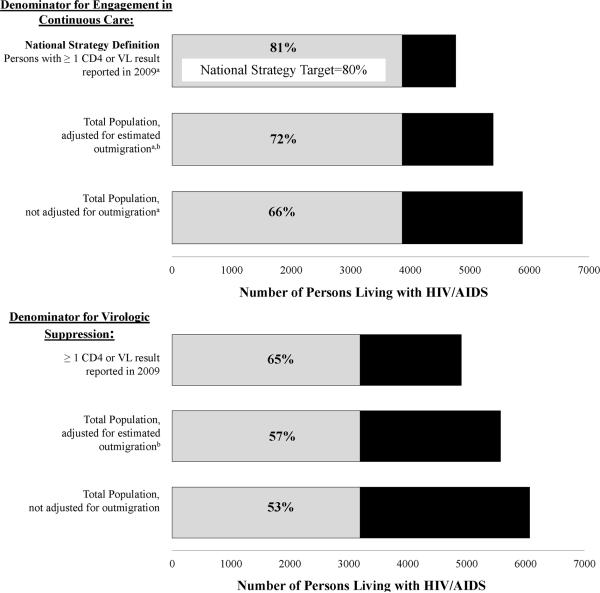
Results: Thirty-two percent of persons had late HIV diagnoses, 31% of whom reported testing HIV negative in the 2 years preceding their HIV diagnoses. Linkage to sustained care, but not linkage to initial care, was significantly associated with subsequent virologic suppression. Among 6070 PLWHA in King County, 65% of those with at least one viral load reported in 2009 and 53% of all PLWHA had virologic suppression. Although only 66% of all PLWHA were engaged in continuous care, 81% were defined as engaged using the denominator proposed in the NHAS (at least one laboratory result reported in 2009 excluding persons establishing care in the second half of the year).
Conclusions: Proposed metrics for monitoring the HIV care continuum may not accurately measure late diagnoses or linkage to sustained care and are sensitive to assumptions about the size of the population of PLWHA. Monitoring progress toward achievement of NHAS goals will require improvements in HIV surveillance data and refinement of care metrics.
Figures
References
-
- White House Office of National AIDS Policy . National HIV/AIDS Strategy for the United States. The White House; Washington, DC: Jul 13, 2010. [Accessed June 1, 2011]. Available at: http://www.whitehouse.gov/sites/default/files/uploads/NHAS.pdf2.
-
- Helms DJ, Weinstock HS, Mahle KC, Bernstein KT, Furness BW, Kent CK, et al. HIV testing frequency among men who have sex with men attending sexually transmitted disease clinics: implications for HIV prevention and surveillance. J Acquir Immune Defic Syndr. 2009;50:320–326. - PubMed
-
- Centers for Disease Control and Prevention and Council of State and Territorial Epidemiologists . Technical Guidance for HIV/AIDS Surveillance Programs, Volume I: Policies and Procedures. Centers for Disease Control and Prevention; Atlanta, Georgia: 2005.
-
- Centers for Disease Control and Prevention Vital signs: HIV testing and diagnosis among adults--United States, 2001–2009. MMWR Morb Mortal Wkly Rep. 2010;59:1550–1555. - PubMed
-
- Health Resources and Services Administration . The HIV/AIDS Bureau HIV Core Clinical Performance Measures for Adult/Adolescent Clients: Group 1. Department of Health and Human Services; Washington, D.C.: [Accessed June 1, 2011]. Available at: ftp://ftp.hrsa.gov/hab/habGrp1PMs08.pdf.
Publication types
MeSH terms
Substances
Grants and funding
LinkOut - more resources
Full Text Sources
Medical
Research Materials
