. 2011 Oct 18:2:508.
doi: 10.1038/ncomms1516.

Engineering modular and orthogonal genetic logic gates for robust digital-like synthetic biology

Affiliations
Free PMC article

Engineering modular and orthogonal genetic logic gates for robust digital-like synthetic biology

Baojun Wang et al. Nat Commun. .
Free PMC article

Abstract

Modular and orthogonal genetic logic gates are essential for building robust biologically based digital devices to customize cell signalling in synthetic biology. Here we constructed an orthogonal AND gate in Escherichia coli using a novel hetero-regulation module from Pseudomonas syringae. The device comprises two co-activating genes hrpR and hrpS controlled by separate promoter inputs, and a σ(54)-dependent hrpL promoter driving the output. The hrpL promoter is activated only when both genes are expressed, generating digital-like AND integration behaviour. The AND gate is demonstrated to be modular by applying new regulated promoters to the inputs, and connecting the output to a NOT gate module to produce a combinatorial NAND gate. The circuits were assembled using a parts-based engineering approach of quantitative characterization, modelling, followed by construction and testing. The results show that new genetic logic devices can be engineered predictably from novel native orthogonal biological control elements using quantitatively in-context characterized parts.


Figures

Figure 1
Figure 1. A modular and orthogonal genetic AND gate design.
The AND gate is designed on the basis of the σ54-dependent hrpR/hrpS hetero-regulation module. Two environment-responsive promoters, P1 and P2, act as the inputs to drive the transcriptions of hrpR and hrpS, and respond to the small molecules I1 and I2, respectively. The transcription of the output hrpL promoter is turned on only when both proteins HrpR and HrpS are present and bind the upstream activator sequence to remodel the closed σ54-RNAP-hrpL transcription complex to an open one through ATP hydrolysis. The output shown is a gfp reporter. The RBS is used for tuning the dynamic range of the device inputs or output. The regulatory promoter inputs and gfp output are both interchangeable. The AND gate is orthogonal to the E. coli genetic background and is independent of its normally used σ70-dependent transcriptional pathway.
Figure 2
Figure 2. Systematic characterization of candidate control elements in various contexts.
(ac) The dose responses of Plac (a), PBAD (b), and Plux (c) promoters to eight increasing induction levels in the two-cell chassis (E. coli MC4100 or E. coli MC1061) in M9-glycerol or M9-glucose media. The same gfp reporter with a strong RBS (rbs30-gfp) was used to measure output fluorescence of the promoter response. (df) Dose responses of Plac (d), PBAD, (e), and Plux (f) using 6 versions of RBS under various induction levels (0, 3.9×10⁻⁴, 1.6×10⁻³, 6.3×10⁻³, 2.5×10⁻², 0.1, 0.4, 1.6, 6.4 and 12.8 mM IPTG for Plac; 0, 3.3×10⁻⁴, 1.3×10⁻³, 5.2×10⁻³, 2.1×10⁻², 8.3×10⁻², 0.33, 1.3, 5.3 and 10.7 mM arabinose for PBAD; and 0, 1.5×10⁻³, 6.1×10⁻³, 2.4×10⁻², 9.8×10⁻², 3.9×10⁻¹, 1.6, 6.3, 25 and 100 nM AHL for Plux), and the fits (solid lines) to the promoter transfer function. (gi) The characterized dose responses of Plac (g), PBAD, (h), and Plux (i) under 30 °C and 37 °C, respectively, and the data fits (solid lines). Here rbsH was chosen for Plac and rbs33 for PBAD and Plux. The inducer concentrations used are the same as in df. In ai, all data (fluorescence/OD600) were the average of three independent repeats in E. coli MC1061 in M9-glycerol at 30 °C unless otherwise stated. Error bars, s.d. (n=3). a.u., arbitrary units.
Figure 3
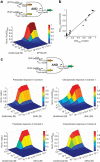
Figure 3. Forward engineering a modular AND gate.
(a) The AND gate was constructed with Plac and PBAD promoters as the two inputs to drive the transcription of hrpR and hrpS. rbsH and rbs33 are used downstream of Plac and PBAD, respectively. The fluorescent response of this device was measured for 72 combinations of input inductions in the standard context as displayed on the bottom. The inducer concentrations used are 0, 3.9×10⁻⁴, 1.6×10⁻³, 6.3×10⁻³, 2.5×10⁻², 0.1, 0.4, 1.6 mM IPTG (left to right) by 0, 3.3×10⁻⁴, 1.3×10⁻³, 5.2×10⁻³, 2.1×10⁻², 8.3×10⁻², 0.33, 1.3, 5.3 mM arabinose (bottom to top). (b) The correlation between the AND gate characterized response and predicted response from its fitted transfer function is strong, with Pearson correlation coefficient of 0.9911. Each point represents one experimental data point from the two-dimensional array in a, compared with the model predicted G/Gmax using equation (2) and fitted [R] and [S] values from equation (1) for the two characterized promoter inputs. (c) The top is the AND gate with a new configuration, constructed using Plux and PBAD as the two inputs. In silico modelling predicts the device behaviour in two different contexts (bottom left), that is Context 1 (E. coli MC1061, M9-glycerol, 30 °C) and Context 2 (E. coli MC1061, M9-glycerol, 37 °C). The experimentally characterized responses of the device under these two contexts are on the bottom right. Inducer concentrations used are 0, 2.4×10⁻², 9.8×10⁻², 3.9×10⁻¹, 1.6, 6.3, 25, 100 nM AHL by 0, 3.3×10⁻⁴, 1.3×10⁻³, 5.2×10⁻³, 2.1×10⁻², 8.3×10⁻², 0.33, 1.3 mM arabinose. To be easily compared with the experimental data, the simulations are plotted with the same inducer concentrations as used for characterization. In a and c, all characterization data are the normalized average of three repeats in E. coli MC1061 in M9-glycerol with variations less than 10% between biological replicates.
Figure 4
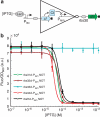
Figure 4. A modular NOT gate design and characterization.
(a) The design of the modular NOT gate (b) The doses responses of the engineered cI/Plam NOT gate were measured using five versions of RBS under the IPTG-inducible Plac promoter. The inducer concentrations used are 0, 3.9×10⁻⁴, 1.6×10⁻³, 6.3×10⁻³, 2.5×10⁻², 0.1, 0.4, 1.6, 6.4 and 12.8 mM IPTG. The data are the average of three repeats in E. coli MC1061 in M9-glycerol at 30 °C. Solid curves are the data fits to the NOT gate transfer function. Error bars, s.d. (n=3).
Figure 5
Figure 5. Engineering and systematic characterization of a combinatorial NAND gate.
(a) The first NAND gate comprises the characterized AND gate module using Plac and PBAD as inputs and the rbs34-cI/Plam NOT gate module. In silico modelling predicts the device behaviour based on parameterized transfer functions of the component modules in the standard context. (b) The second NAND gate comprises the AND gate module using Plux and PBAD as inputs and the rbs32-cI/Plam NOT gate module. In silico modelling predicts the device behaviour based on component parameterized transfer functions at 37 °C under the otherwise standard context. The fitted AND and NOT gate transfer functions at the standard context was used for this simulation and assumed to vary negligibly at 37 °C. (c) Response of the NAND gate as in a under 64 combinations of input inductions (0, 3.9×10⁻⁴, 1.6×10⁻³, 6.3×10⁻³, 2.5×10⁻², 0.1, 0.4, 1.6 mM IPTG by 0, 3.3×10⁻⁴, 1.3×10⁻³, 5.2×10⁻³, 2.1×10⁻², 8.3×10⁻², 0.33, 1.3 mM arabinose) measured by fluorometry in the standard context. (d) Response of the NAND gate as in b for 64 combinations of input inductions (0, 2.4×10⁻², 9.8×10⁻², 3.9×10⁻¹, 1.6, 6.3, 25, 100 nM AHL by 0, 3.3×10⁻⁴, 1.3×10⁻³, 5.2×10⁻³, 2.1×10⁻², 8.3×10⁻², 0.33, 1.3 mM arabinose) at 37 °C by fluorometry assay. (e) FACS assay of the NAND gate as in a under four logic combinations of input inductions: (I) 1.3 mM arabinose plus 1.6 mM IPTG, (II) 1.3 mM arabinose, (III) 1.6 mM IPTG, (IV) none. (f) FACS assay of the NAND gate as in b under four input inductions: (I) 1.3 mM arabinose plus 100 nM AHL, (II) 1.3 mM arabinose, (III) 100 nM AHL, (IV) none. Data in c and d are the normalized average of three repeats in E. coli MC1061 in M9-glycerol with variations less than 10% between biological replicates.
Figure 6
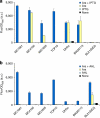
Figure 6. Circuit chassis compatibility assays.
(a) Qualitative assays of the functionality of the AND gate using Plac and PBAD as the two inputs in seven E. coli strains. Four input inductions were studied—1.3 mM arabinose plus 1.6 mM IPTG, 1.3 mM arabinose only, 1.6 mM IPTG only, and no inducers. Cells were grown in M9-glycerol at 30 °C and assayed after 5 h on induction. (b) Qualitative assays of the functionality of the AND gate using Plux and PBAD as the two inputs in seven E. coli strains. Four input inductions were studied—1.3 mM arabinose plus 100 nM AHL, 1.3 mM arabinose only, 100 nM AHL only, and no inducers. Cells were grown in M9-glycerol at 37 °C and assayed after 5 h on induction. Error bars, s.d. (n=3).

References

    1. Alon U. An Introduction to Systems Biology: Design Principles of Biological Circuits (Chapman & Hall/CRC, 2007).
    1. Lim W. A. Designing customized cell signalling circuits. Nat. Rev. Mol. Cell Biol. 11, 393–403 (2010). - PMC - PubMed
    1. Morris M. K., Saez-Rodriguez J., Sorger P. K. & Lauffenburger D. A. Logic-based models for the analysis of cell signaling networks. Biochemistry 49, 3216–3224 (2010). - PMC - PubMed
    1. Khalil A. S. & Collins J. J. Synthetic biology: applications come of age. Nat. Rev. Genet. 11, 367–379 (2010). - PMC - PubMed
    1. Joshi N., Wang X., Montgomery L., Elfick A. & French C. E. Novel approaches to biosensors for detection of arsenic in drinking water. Desalination 248, 517–523 (2009).

Publication types