. 2011 Oct 18;30(21):4356-70.
doi: 10.1038/emboj.2011.379.

The mitochondrial contact site complex, a determinant of mitochondrial architecture

Affiliations

The mitochondrial contact site complex, a determinant of mitochondrial architecture

Max Harner et al. EMBO J. .

Abstract

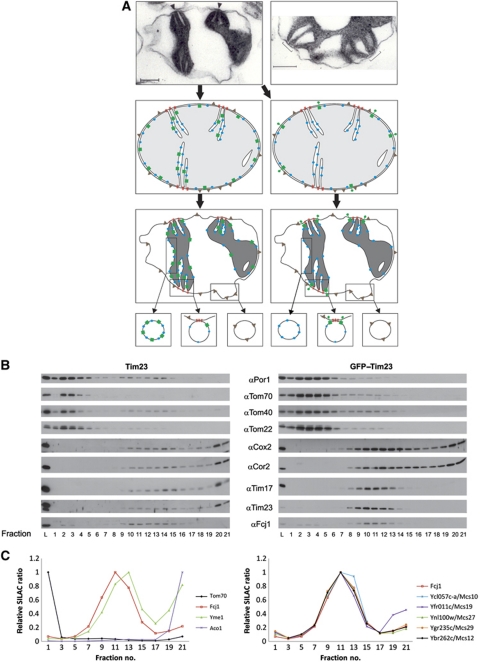
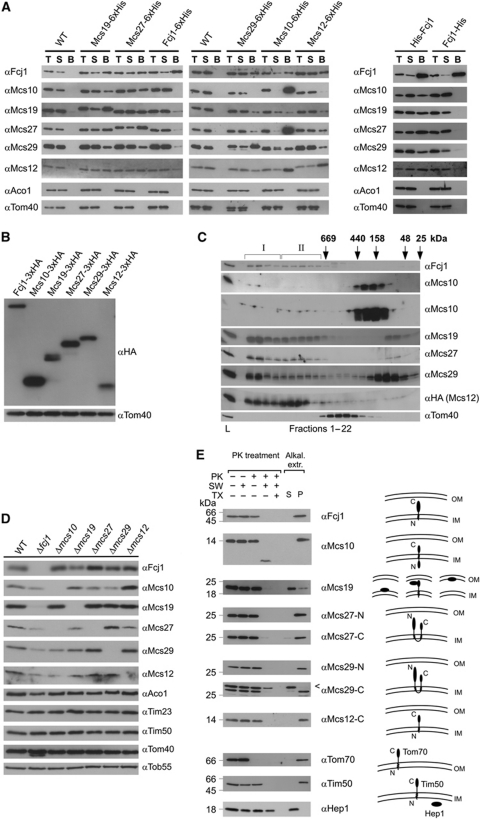
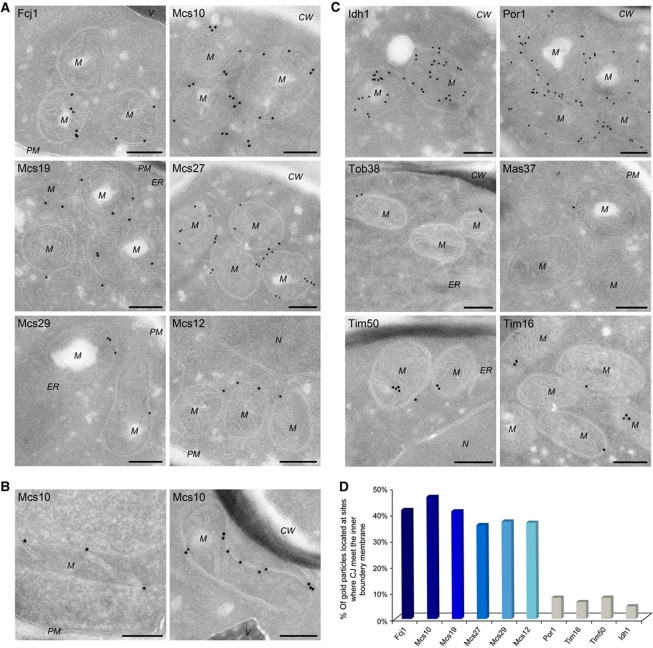
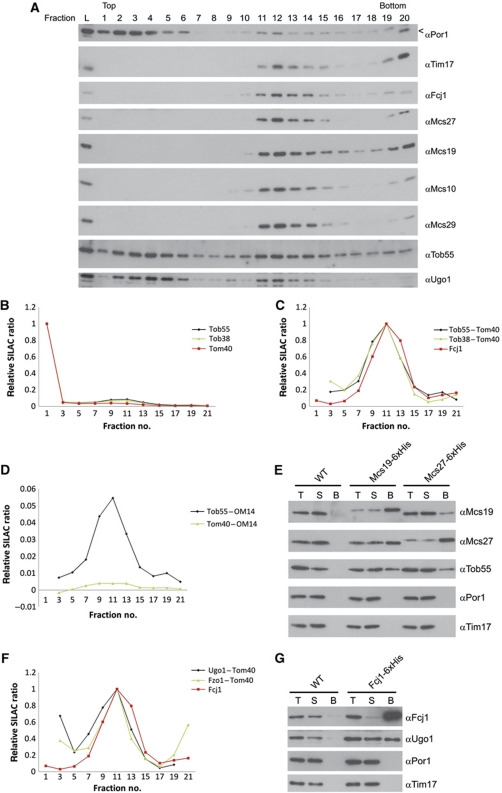
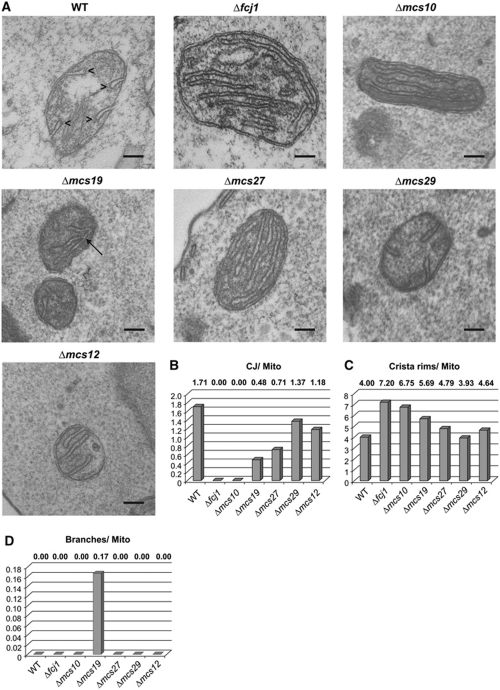
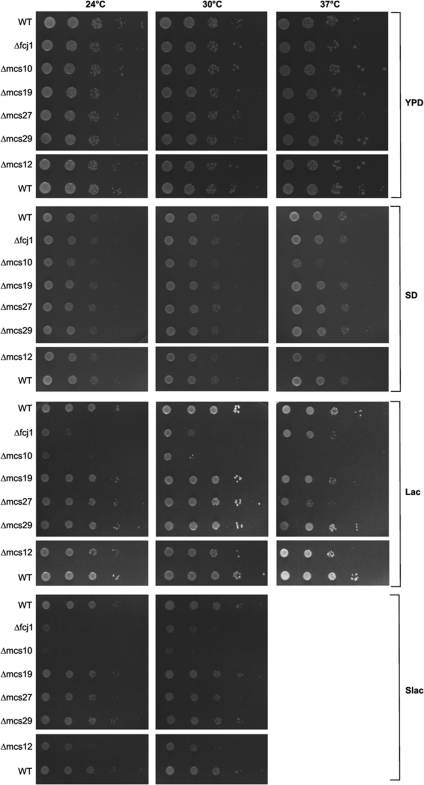
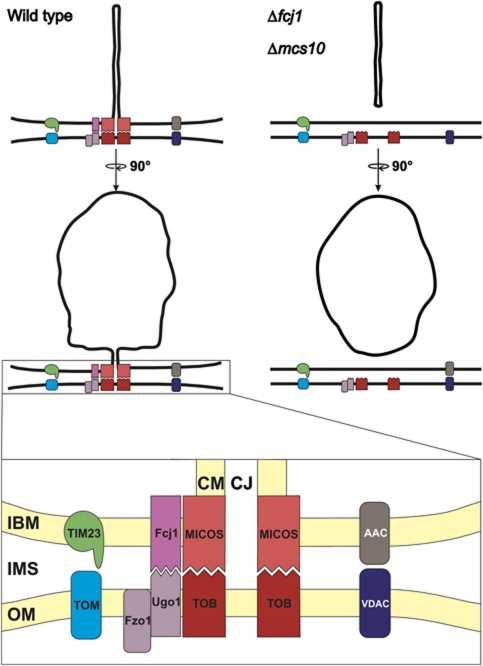
Mitochondria are organelles with a complex architecture. They are bounded by an envelope consisting of the outer membrane and the inner boundary membrane (IBM). Narrow crista junctions (CJs) link the IBM to the cristae. OMs and IBMs are firmly connected by contact sites (CS). The molecular nature of the CS remained unknown. Using quantitative high-resolution mass spectrometry we identified a novel complex, the mitochondrial contact site (MICOS) complex, formed by a set of mitochondrial membrane proteins that is essential for the formation of CS. MICOS is preferentially located at the CJs. Upon loss of one of the MICOS subunits, CJs disappear completely or are impaired, showing that CJs require the presence of CS to form a superstructure that links the IBM to the cristae. Loss of MICOS subunits results in loss of respiratory competence and altered inheritance of mitochondrial DNA.


Conflict of interest statement

The authors declare that they have no conflict of interest.

Figures

Figure 1
Figure 1
Identification of Mcs proteins. (A) Rationale for the analysis of distribution of membrane proteins in mitochondria. (Upper panels) Electron micrographs of sections of mitochondria from Neurospora crassa subjected to osmotic shrinking (‘condensed configuration’). Size bars, 200 nm. Arrowheads show regions of attachment between IM and OM (contact sites, CS); brackets indicate CS at higher magnification where two cristae invaginate in close neighbourhood. (Middle panels) ‘Orthodox configuration’ was reconstructed from the electron micrograph in the upper panel (see arrows). Left, mitochondria from wild type, expressing untagged Tim23; right, mitochondria from cells expressing GFP–Tim23. (Lower panels) Distribution of proteins indicated above after shrinking of mitochondria and theoretically generated vesicles. Symbols: red lines, putative proteins of CS; blue balls, IM proteins; green squares, Tim23; green dumbbells, GFP–Tim23; grey triangles, OM proteins. (B) Separation of vesicles of mitochondria from Tim23 and GFP–Tim23 expressing cells (left and right panels, respectively) by flotation equilibrium gradient centrifugation. Fractions were analysed by SDS–PAGE and immunodecorated with the indicated antibodies. L, load fraction. Odd numbered fractions of the gradients were analysed. (C) Analysis of mitochondrial fractions prepared as in (B) by quantitative mass spectrometry (SILAC). Distribution of marker proteins and of proteins qualifying as components of CS. (Left panel) Profiles of examples of OM proteins, IM proteins, matrix proteins and Fcj1. (Right panel) Profiles of six proteins that qualify as Mcs proteins. See also Supplementary Figure S1 for further controls.
Figure 2
Figure 2
The MICOS complex. (A) Co-isolation of Mcs proteins. His-tagged versions of the Mcs proteins were expressed under control of their own promoters (left panel) or from the pYX242 plasmid (right panel) in the respective deletion strain. Mitochondria were isolated, solubilized with digitonin and incubated with Ni-NTA beads. Total (T, 5% of total), supernatant (S, 5% of total) and bound material (B, 100%) were analysed by SDS–PAGE and immunodecoration with the indicated antibodies. Mitochondria from wild-type cells served as control. (B) Relative abundance of Mcs proteins. HA-tagged versions of the Mcs proteins were expressed under their own promoters. Equal amounts of mitochondria were analysed by SDS–PAGE and immunoblotting with antibodies against the HA-tag (αHA) and against Tom40 (αTom40), the loading control. (C) Molecular sizing of Mcs proteins from wild-type mitochondria. Mitochondria were lysed with digitonin and lysates subjected to gel filtration on a Superose 6 column. The fractions were analysed by SDS–PAGE and immunoblotting using the indicated antibodies; in case of Msc12, a strain was used which expressed HA-tagged Msc12 and immunoblotting was with αHA antibody. Msc10 blots were exposed for two different time periods. The TOM complex (Tom40) was decorated as a control. I and II, MICOS complex I and II. Positions of marker proteins for calibration are indicated with arrows. L, load (10% of material applied to column). See also Supplementary Figure S2A. (D) Steady-state levels of Mcs proteins in cells in which one of the MCS genes was deleted. Mitochondria were analysed by SDS–PAGE and immunoblotting. See also Supplementary Figure S2B. (E) Membrane integration and orientation of Mcs proteins. (Left) Mitochondria from wild-type cells were left untreated or treated with proteinase K (PK) either directly, after subjecting them to osmotic swelling (SW) or after lysis with Triton X-100 (TX); bars indicate the apparent molecular masses of the full-length proteins. (Right) Mitochondria were exposed to alkaline extraction at pH 12. Soluble (S) and membrane integrated (P, pellet) material were separated by centrifugation. Aliquots were subjected to SDS–PAGE and immunodecoration with antibodies against the indicated proteins. Arrowhead, unspecific cross-reaction.
Figure 3
Figure 3
Localization of Mcs proteins by immuno-EM. Cells expressing C-terminally HA-tagged versions of Mcs proteins, were processed for immuno-EM, cryosections were labelled with anti-HA antibodies and protein A bound gold particles, with the exception of Por1, for which specific antibodies were used. (A) Distribution of Mcs proteins in cells grown on lactate. (B) Mcs10 localization in cells grown on glycerol. (C) Distribution of proteins of various mitochondrial subcompartments in cells grown on lactate. Matrix (Idh1); OM, (Por1, Tob38 and Mas37/Tob37); inner boundary and crista membrane (Tim50 and Tim16). CW, cell wall; M, mitochondrion; N, nucleus; PM, plasma membrane; V, vacuole. Size bars, 200 nm. Additional examples in Supplementary Figure S3. (D) Quantitative analysis of the distribution of Mcs and control proteins at sites where the CJ meet the IBM. For each labelling, the percentage of gold particles present at the CJ was determined.
Figure 4
Figure 4
Interaction of Mcs proteins with components of the OM. (A) Wild-type mitochondria were fractionated and subjected to density flotation centrifugation as in Figure 1B. Fractions were subjected to SDS–PAGE and immunodecoration with antibodies against Por1, Tim17, Mcs proteins, Tob55 and Ugo1. (B) Analysis of the distribution on flotation gradients of Tob55 and Tob38 compared with Tom40 by mass spectrometry. (C) Differential profiles of Tob55 and Tob38 after subtraction of the profile of Tom40. (D) Subtraction of the profiles of two OM proteins, Tom40 and OM14, from each other. (E) Co-isolation of Tob55 with Mcs19 and Mcs27. For details see Figure 2A. (F) Density gradient profiles of Ugo1 and Fzo1 processed as in (C). (G) Co-isolation of Ugo1 with Fcj1. Analysis as in (E), with the exception that Triton X-100 was used for solubilization. Arrow head, unspecific cross reaction.
Figure 5
Figure 5
Morphological roles of Mcs proteins. (A) Electron micrographs of mitochondria of wild-type cells and of cells lacking the various Mcs proteins. Cells were fixed with glutaraldehyde and sections contrasted with OsO4. Size bar, 100 nm. (BD) Quantitative evaluation of images. Average numbers of (B) CJs, (C) crista rims and (D) crista branches per mitochondrial profile. Additional examples and quantifications in Supplementary Figures S4B and S5 and Supplementary Table SII. Arrowheads, crista rims; arrow, crista branch.
Figure 6
Figure 6
Growth characteristics of cells lacking Mcs proteins. Cells were spotted in 10-fold dilution steps on agar plates containing one of the following media: glucose and yeast extract (YPD); glucose-containing synthetic medium (SD); lactate-containing medium (Lac); lactate-containing synthetic medium (Slac). Plates were incubated at the indicated temperatures. None of the strains grew on Slac at 37°C.
Figure 7
Figure 7
Working model of the role of the MICOS complex in mitochondrial architecture. (Upper panels) Mitochondrion of wild-type cells (left) and of cells lacking Fcj1 or Mcs10 (right) in two orientations. (Lower panel) Blow-up of CS with interaction of MICOS-TOB and of Fcj1–Ugo1–Fzo1. Dynamic interaction of TOM and TIM protein import complexes, and of AAC (ADP/ATP carrier) and VDAC/porin bridging the IMS, supported by CS. For further explanation and abbreviations see Discussion.

Similar articles

Cited by

References

    1. Andersen JS, Wilkinson CJ, Mayor T, Mortensen P, Nigg EA, Mann M (2003) Proteomic characterization of the human centrosome by protein correlation profiling. Nature 426: 570–574 - PubMed
    1. Bayer ME (1991) Zones of membrane adhesion in the cryofixed envelope of Escherichia coli. J Struct Biol 107: 268–280 - PubMed
    1. Boldogh IR, Pon LA (2006) Interactions of mitochondria with the actin cytoskeleton. Biochim Biophys Acta 1763: 450–462 - PubMed
    1. Brdiczka DG, Zorov DB, Sheu SS (2006) Mitochondrial contact sites: their role in energy metabolism and apoptosis. Biochim Biophys Acta 1762: 148–163 - PubMed
    1. Chan D, Frank S, Rojo M (2006) Mitochondrial dynamics in cell life and death. Cell Death Differ 13: 680–684 - PubMed

Publication types

MeSH terms